Prometheus, Loki, And Grafana
This guide explains how to monitor FusionAuth logs and metrics with the open-source tools Prometheus, Loki, and Grafana, and receive alerts when problems occur.
Please read the FusionAuth monitoring overview for details on FusionAuth metrics, the activities in a complete monitoring workflow, and what Prometheus, Loki, and Grafana are. Review the alternative monitoring services in the overview to ensure that Prometheus is the right tool for your needs.
This guide will show you how to set up Prometheus in Docker containers on your local machine. However, a paid, cloud-hosted alternative is also available from Grafana Cloud.
Initial Architecture#
Running FusionAuth and PostgreSQL in Docker usually looks like the diagram below (you might also run OpenSearch in another Docker container).
graph LR
  D(User)
  subgraph I[Your server]
    subgraph G[Docker]
      H[(PostgreSQL)]
    end
    subgraph C[Docker]
      A(FusionAuth)
    end
    subgraph J[Docker]
      F(Your app)
    end
  end
  D --> J
  D --> C
  C --> G
  F --> C
  style I fill:#999
This diagram shows three components that could die and need monitoring: the PostgreSQL database, FusionAuth, and the app (web server) that directs users to FusionAuth for login. In this guide, you'll focus on monitoring FusionAuth by adding Prometheus to your setup. Prometheus will poll your FusionAuth instance for errors every fifteen seconds.
graph LR
  D(User)
  subgraph I[Your server]
    subgraph G[Docker]
      H[(PostgreSQL)]
    end
    subgraph C[Docker]
      A(FusionAuth)
    end
    subgraph E[Docker]
      B(Prometheus)
    end
    subgraph J[Docker]
      F(Your app)
    end
  end
  D --> J
  D --> C
  C --> G
  F --> C
  E --> |Prometheus pulls metrics from FusionAuth| C
  style I fill:#999
  style E fill:#944
These instructions are for monitoring FusionAuth with Prometheus when you are self-hosting. FusionAuth Cloud deployments with more than one compute node round-robin requests to the Prometheus endpoint. Using this endpoint to monitor such a deployment is not recommended. Learn more about this issue here.
Run Prometheus To Monitor FusionAuth#
Clone the sample FusionAuth kickstart repository with the command below.
git clone https://github.com/FusionAuth/fusionauth-example-docker-compose.git
cd fusionauth-example-docker-compose/light
Add the following code to docker-compose.yaml near the end, before the networks: section, to define a new service. The service uses the Ubuntu Docker image from Docker Hub for Prometheus.
  prometheus:
    image: ubuntu/prometheus:2.52.0-22.04_stable
    platform: linux/amd64
    container_name: faProm
    depends_on:
      - fa
    ports:
      - 9090:9090
    networks:
      - db_net
    volumes:
      - ./prometheusConfig.yml:/etc/prometheus/prometheus.yml
      - ./prometheusDb:/prometheus
This service definition specifies that Prometheus starts after FusionAuth, is accessible on port 9090, and saves its database and configuration file in persistent directories on your machine.
Create a prometheusConfig.yml configuration file containing the content below.
global:
  evaluation_interval: 30s
scrape_configs:
  - job_name: FusionAuth
    scrape_interval: 15s
    scheme: http
    metrics_path: api/prometheus/metrics
    static_configs:
      - targets: ["fa:9011"]
    basic_auth:
      username: "apikey"
      password: "33052c8a-c283-4e96-9d2a-eb1215c69f8f-not-for-prod"
This configures Prometheus to collect metrics from FusionAuth every 15 seconds and evaluate the metrics every 30 seconds. Prometheus uses the superuser API key, created by the FusionAuth kickstart configuration files, as password. For improved security in production, create an API key that has only GET permissions for the /api/prometheus/metrics endpoint.
If you prefer to allow unauthenticated access to the Prometheus metrics endpoint in FusionAuth from any local scraper, you can set fusionauth-app.local-metrics.enabled=true. See the FusionAuth configuration reference for more information.
To learn more about configuring Prometheus, see the documentation.
Run all the containers with docker compose up. You should be able to log in to FusionAuth at http://localhost:9011 with email address admin@example.com and password password, and to Prometheus at http://localhost:9090.
To check that Prometheus has accepted your configuration file as valid, enter the container and use promtool to validate the YAML file.
docker exec -it faProm /bin/bash

promtool check config /etc/prometheus/prometheus.yml

exit
The metrics FusionAuth exposes to Prometheus change over time. Some basic Java Virtual Machine (JVM) metrics are listed here. You can see exactly what metrics are available on your FusionAuth instance by running the command below.
curl -u "apikey:33052c8a-c283-4e96-9d2a-eb1215c69f8f-not-for-prod" 0.0.0.0:9011/api/prometheus/metrics

# Output:

# HELP HikariPool_1_pool_MinConnections Generated from Dropwizard metric import (metric=HikariPool-1.pool.MinConnections, type=com.zaxxer.hikari.metrics.dropwizard.CodaHaleMetricsTracker$$Lambda$292/0x0000000100449e40)
# TYPE HikariPool_1_pool_MinConnections gauge
HikariPool_1_pool_MinConnections 10.0
# HELP jvm_memory_heap_committed Generated from Dropwizard metric import (metric=jvm.memory.heap.committed, type=com.codahale.metrics.jvm.MemoryUsageGaugeSet$8)
# TYPE jvm_memory_heap_committed gauge
jvm_memory_heap_committed 5.36870912E8
# HELP prime_mvc___api_key_generate__requests Generated from Dropwizard metric import (metric=prime-mvc.[/api/key/generate].requests, type=com.codahale.metrics.Timer)
# TYPE prime_mvc___api_key_generate__requests summary
prime_mvc___api_key_generate__requests{quantile="0.5",} 0.2392109
prime_mvc___api_key_generate__requests{quantile="0.75",} 0.2392109
prime_mvc___api_key_generate__requests{quantile="0.95",} 0.2392109
prime_mvc___api_key_generate__requests{quantile="0.98",} 0.2392109
prime_mvc___api_key_generate__requests{quantile="0.99",} 0.2392109
prime_mvc___api_key_generate__requests{quantile="0.999",} 0.2392109
prime_mvc___api_key_generate__requests_count 1.0
...
If you get no response, add -v to the command to see what error occurs. If you see 401, it is likely that your API key is incorrect.
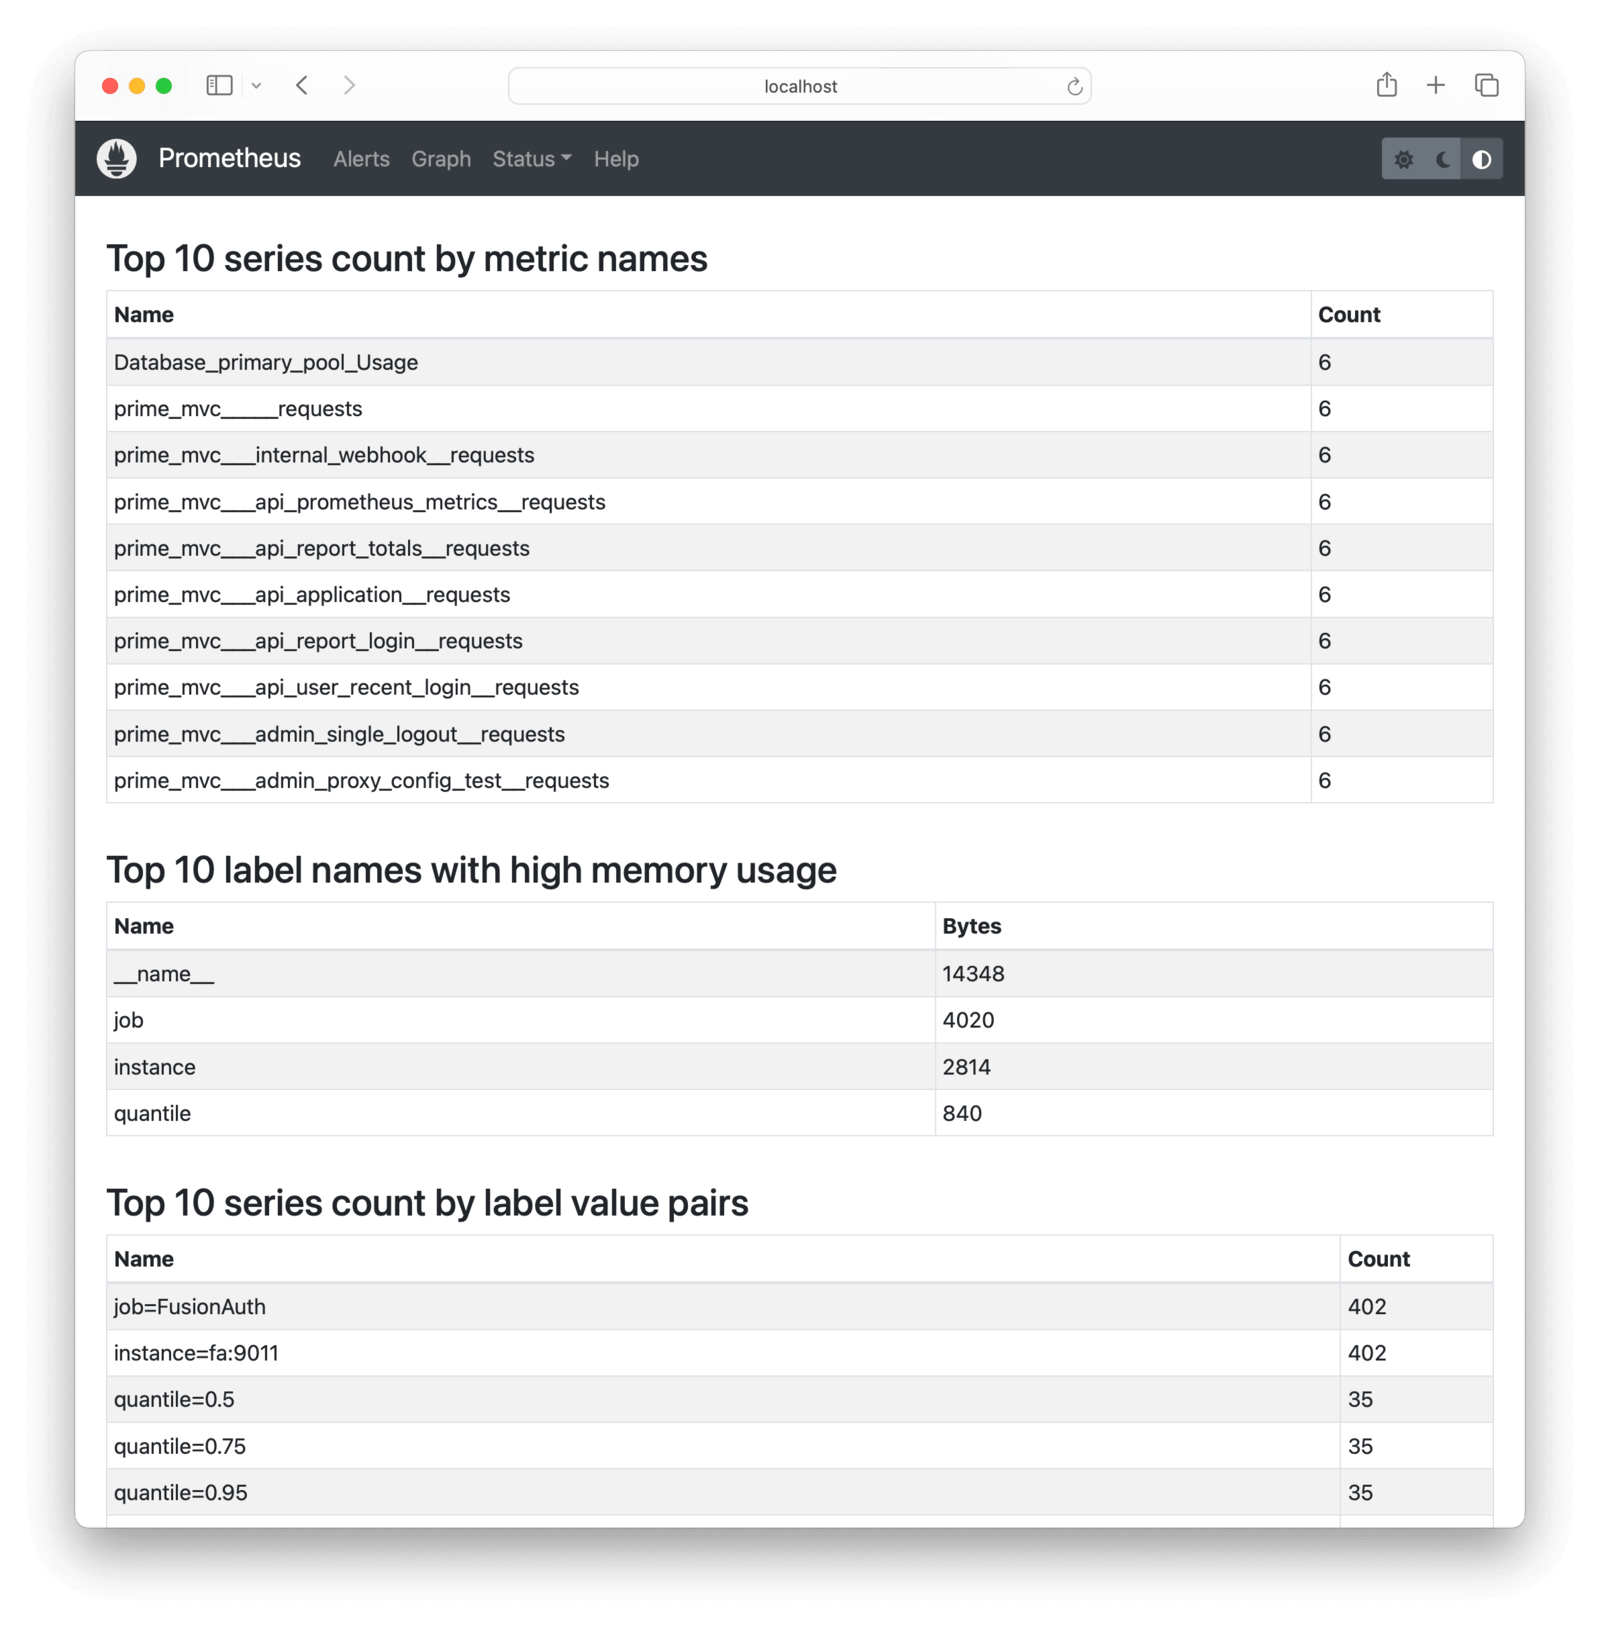
Check what metrics Prometheus scraped from FusionAuth in the Prometheus web interface by browsing to Menu -> Status -> TSDB Status (time-series database).
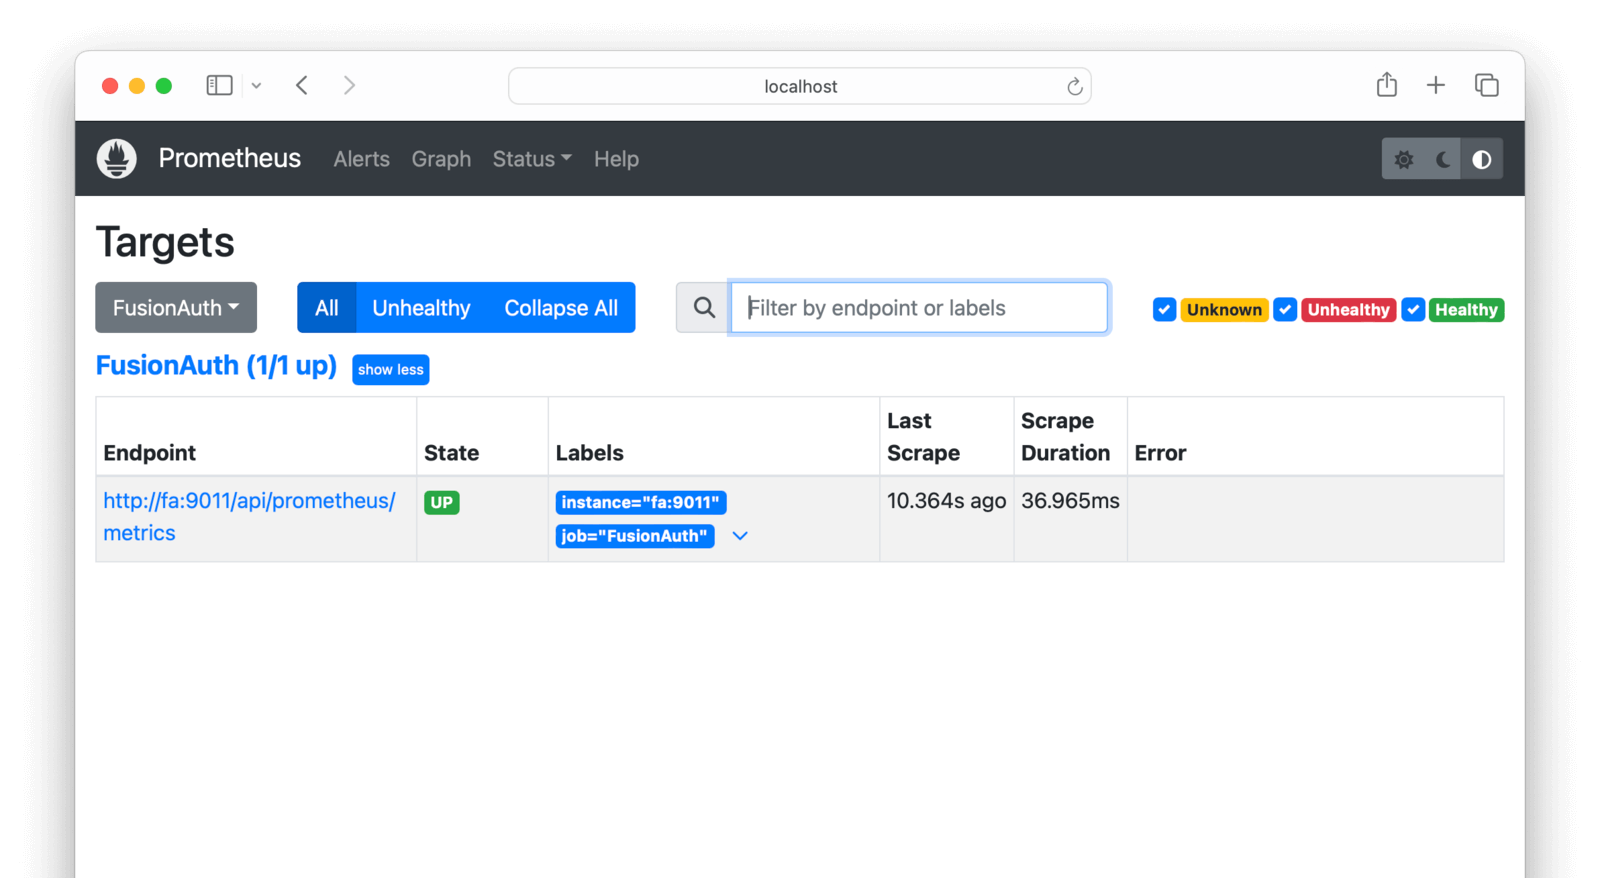
In the Prometheus web interface, check that FusionAuth is running by browsing to Menu -> Status -> Targets .
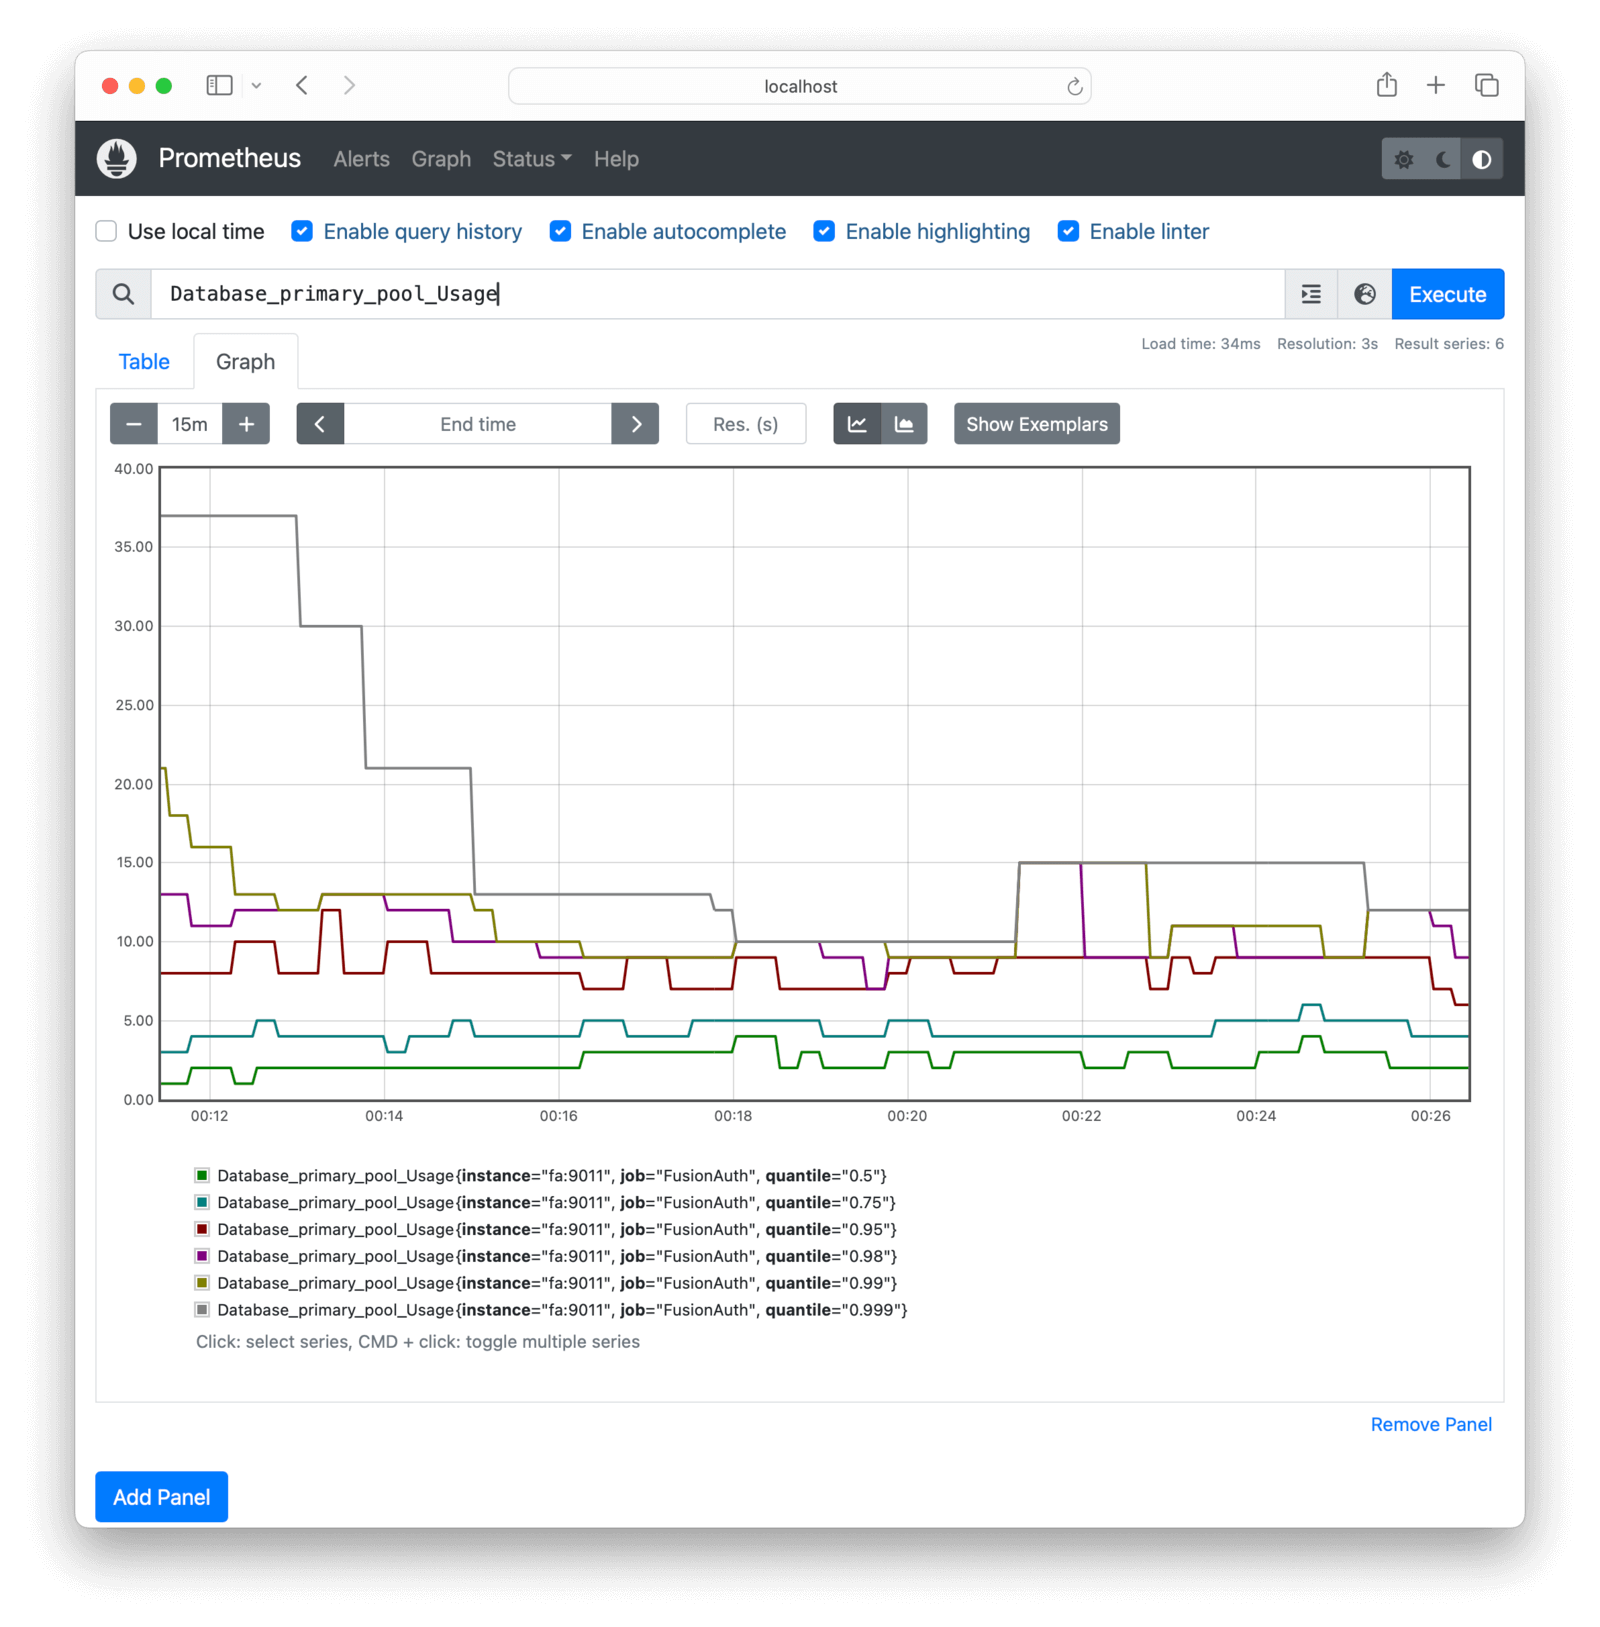
See charts of FusionAuth metrics in the Prometheus web interface by browsing to Menu -> Graph . Push Ctrl + Spacebar in the text box to view all the metrics and functions available. Try entering Database_primary_pool_Usage and clicking Execute .
To monitor all FusionAuth errors, use the expression prime_mvc_____errors_total. A useful metric to monitor is simply called up, which has the value 1 if Prometheus successfully scraped its target.
At this point, Prometheus is set up and you can monitor FusionAuth. The rest of this guide will show you how to enhance the system with alerts and an improved dashboard.
Run Alertmanager To Send Alerts#
Let's set up a service to notify you when errors occur in FusionAuth.
The service will check if the prime_mvc_____errors_total counter has increased in the last minute. If it has, FusionAuth will send a message to a channel that your company can monitor, for example, on Discord or Slack, or by email or SMS.
The simplest and cheapest alert service is ntfy.sh. ntfy is free, but all channels are public, so don't broadcast secrets.
To see how ntfy works, run the command below in a terminal.
curl -H "Title: Error" -d "A FusionAuth error occurred in the last minute" ntfy.sh/fusionauthprometheusBrowse to the channel at https://ntfy.sh/fusionauthprometheus to see messages.
Now let's configure Prometheus to send errors automatically using the Prometheus Alertmanager component.
The Prometheus documentation doesn't say it explicitly, but Alertmanager is not included with Prometheus and must be run separately. This guide runs Alertmanager using the Ubuntu Docker container.
At the time of writing, FusionAuth found an error in the Ubuntu container documentation. The Alertmanager configuration file path is actually /etc/alertmanager/alertmanager.yml not /etc/prometheus/alertmanager.yml.
Below is a diagram of the system design with the new components.
graph LR
  D(User)
  N(Ntfy.sh)
  subgraph I[Your server]
    subgraph G[Docker]
      H[(PostgreSQL)]
    end
    subgraph C[Docker]
      A(FusionAuth)
    end
    subgraph E[Docker]
      B(Prometheus)
    end
    subgraph K[Docker]
      L(AlertManager)
    end
    subgraph J[Docker]
      F(Your app)
    end
  end
  D --> J
  D --> C
  C --> G
  F --> C
  E --> |Prometheus pulls metrics from FusionAuth| C
  E --> K
  K --> N
  style I fill:#999
  style E fill:#944
  style K fill:#944
  style N fill:#944
Add the code below to the docker-compose.yml file to include the new Alertmanager container and point the existing Prometheus container to it.
  alertmanager:
    image: ubuntu/alertmanager:0.27.0-22.04_stable
    platform: linux/amd64
    container_name: faAlert
    ports:
      - 9093:9093
    networks:
      - db_net
    volumes:
      - ./prometheusAlertConfig.yml:/etc/alertmanager/alertmanager.yml

  prometheus:
    image: ubuntu/prometheus:2.52.0-22.04_stable
    platform: linux/amd64
    container_name: faProm
    depends_on:
      - fa
      - alertmanager
    ports:
      - 9090:9090
    networks:
      - db_net
    volumes:
      - ./prometheusConfig.yml:/etc/prometheus/prometheus.yml
      - ./prometheusRules.yml:/etc/prometheus/rules.yml
      - ./prometheusDb:/prometheus
Update prometheusConfig.yml to provide Prometheus with the URL of the Alertmanager service and define the rules for when alerts should be sent.
global:
  evaluation_interval: 30s
scrape_configs:
  - job_name: FusionAuth
    scrape_interval: 15s
    scheme: http
    metrics_path: api/prometheus/metrics
    static_configs:
      - targets: ["fa:9011"]
    basic_auth:
      username: "apikey"
      password: "33052c8a-c283-4e96-9d2a-eb1215c69f8f-not-for-prod"
rule_files:
  - rules.yml
alerting:
  alertmanagers:
    - static_configs:
        - targets:
            - "alertmanager:9093"
Create the prometheusRules.yml file below.
groups:
  - name: fusionauthAlerts
    rules:
      - alert: FusionAuthError
        expr: prime_mvc_____requests_count > 0
        for: 30s
        labels:
          severity: error
        annotations:
          summary: FusionAuth Error Detected
          description: A FusionAuth error occurred in the last minute
Here, the expr expression rule checks the requests metric, not the errors metric, to be sure that a notification is sent in this prototype. In reality, you could use an error metric like increase(prime_mvc_____errors_total[1m]) > 0.
Finally, create a prometheusAlertConfig.yml configuration file for the Alertmanager.
route:
  receiver: ntfy
  repeat_interval: 1m
receivers:
  - name: ntfy
    webhook_configs:
- url: http://ntfy.sh/fusionauthprometheusYou can rename all these configuration files, as long as you update the filenames in the docker-compose.yaml file, too.
Push Ctrl + C in the terminal, and then run docker compose up again to start everything. Check the terminal logs to confirm that Alertmanager started successfully. If it didn't, check the configuration file and try to restart the service individually with docker compose up alertmanager.
Confirm that Alertmanager can connect to ntfy manually by running the command below in a new terminal.
curl -X POST -H "Content-Type: application/json" -d '[{"labels":{"alertname":"TestAlert"}}]' http://localhost:9093/api/v2/alertsIf you browse to http://localhost:9093, you should see the alert has arrived. Browse to the Status page to check that Alertmanager has successfully loaded the configuration file.
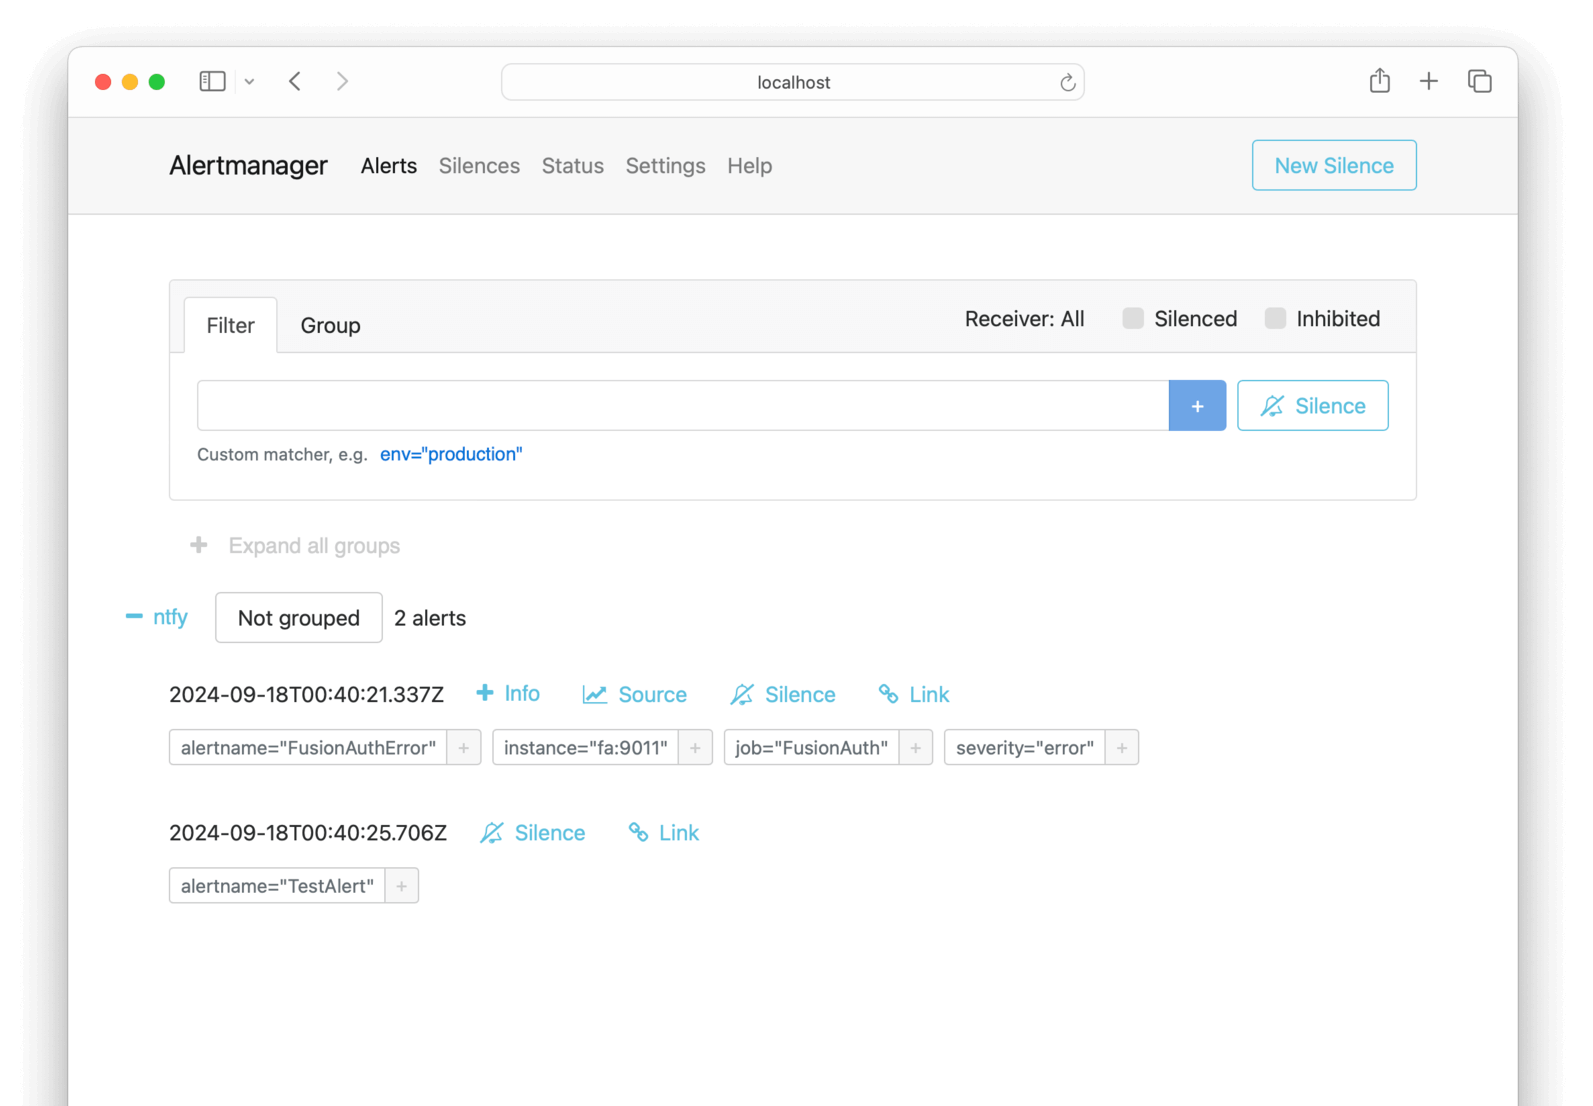
If you wait a minute and then browse to https://ntfy.sh/fusionauthprometheus, you should see that Prometheus scraped FusionAuth, registered that requests were greater than zero, and sent an alert to Alertmanager, and that Alertmanager sent the alert to ntfy.
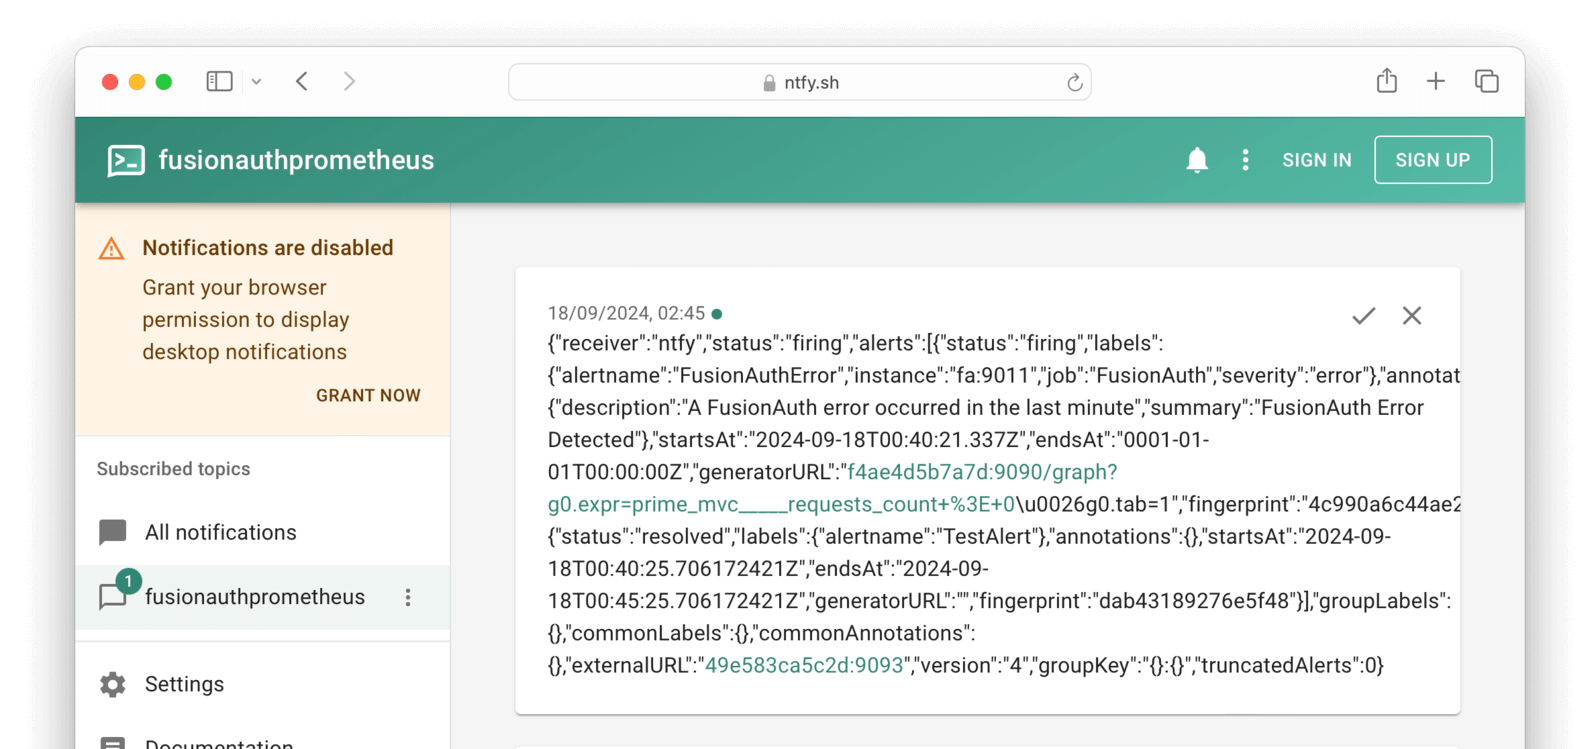
Alertmanager sent ntfy raw JSON that includes the annotations fields from the prometheusRules.yml configuration. If you would like notifications to look neater, read about templates in Prometheus.
Run Grafana To Create A Dashboard#
To display FusionAuth metrics in a set of charts in a dashboard instead of a single Prometheus query, you can use Grafana.
This section will show you how to run Grafana in Docker and create a simple dashboard to monitor FusionAuth.
Below is a diagram of the system design with the new components.
graph LR
  D(User)
  subgraph I[Your server]
    subgraph G[Docker]
      H[(PostgreSQL)]
    end
    subgraph C[Docker]
      A(FusionAuth)
    end
    subgraph E[Docker]
      B(Prometheus)
    end
    subgraph J[Docker]
      F(Your app)
    end
    subgraph M[Docker]
      O(Grafana)
    end
  end
  D --> J
  D --> C
  C --> G
  F --> C
  E --> |Prometheus pulls metrics from FusionAuth| C
  M --> E
  style I fill:#999
  style E fill:#944
  style M fill:#944
Add the new service below to docker-compose.yml.
  grafana:
    image: ubuntu/grafana:11.0.0-22.04_stable
    platform: linux/amd64
    container_name: faGraf
    depends_on:
      - prometheus
    ports:
      - 9091:3000
    networks:
      - db_net
    volumes:
      - ./prometheusGrafanaConfig.ini:/etc/grafana/grafana-config.ini
      - ./prometheusGrafana/:/data/
      # - ./prometheusGrafanaProvisioning/:/conf/
This configuration uses the Ubuntu Grafana container to maintain consistency with the Ubuntu containers used previously.
None of the three volumes in the configuration above are needed for this example, but you will want to use them in production.
- The
/etc/grafana/grafana-config.iniGrafana configuration file specifies values for settings like security, proxies, and servers. These values are explained in the configuration documentation. Note that the documentation lists various places the configuration file could live inside the container. This path will differ between Docker images and operating systems. By default, the filename/etc/grafana/grafana.iniis different from thegrafana-config.iniin this container. If you use a different image for Grafana, look at the Docker logs in the terminal to see where Grafana looks for configuration files when starting. - The
/datavolume stores the Grafana database so that data persists if you restart the container. - The
/confdirectory allows you to automatically provision infrastructure like data sources for Grafana to monitor and dashboards to create. Leave the volume commented out for now. If you uncomment it without having the correct files in your local directory, Grafana will fail to start. To create provisioning files, read the documentation and look at all the sample files in/conf/provisioning/when the container is running.
Run docker compose up to start Grafana (or docker compose up grafana if FusionAuth is already running).
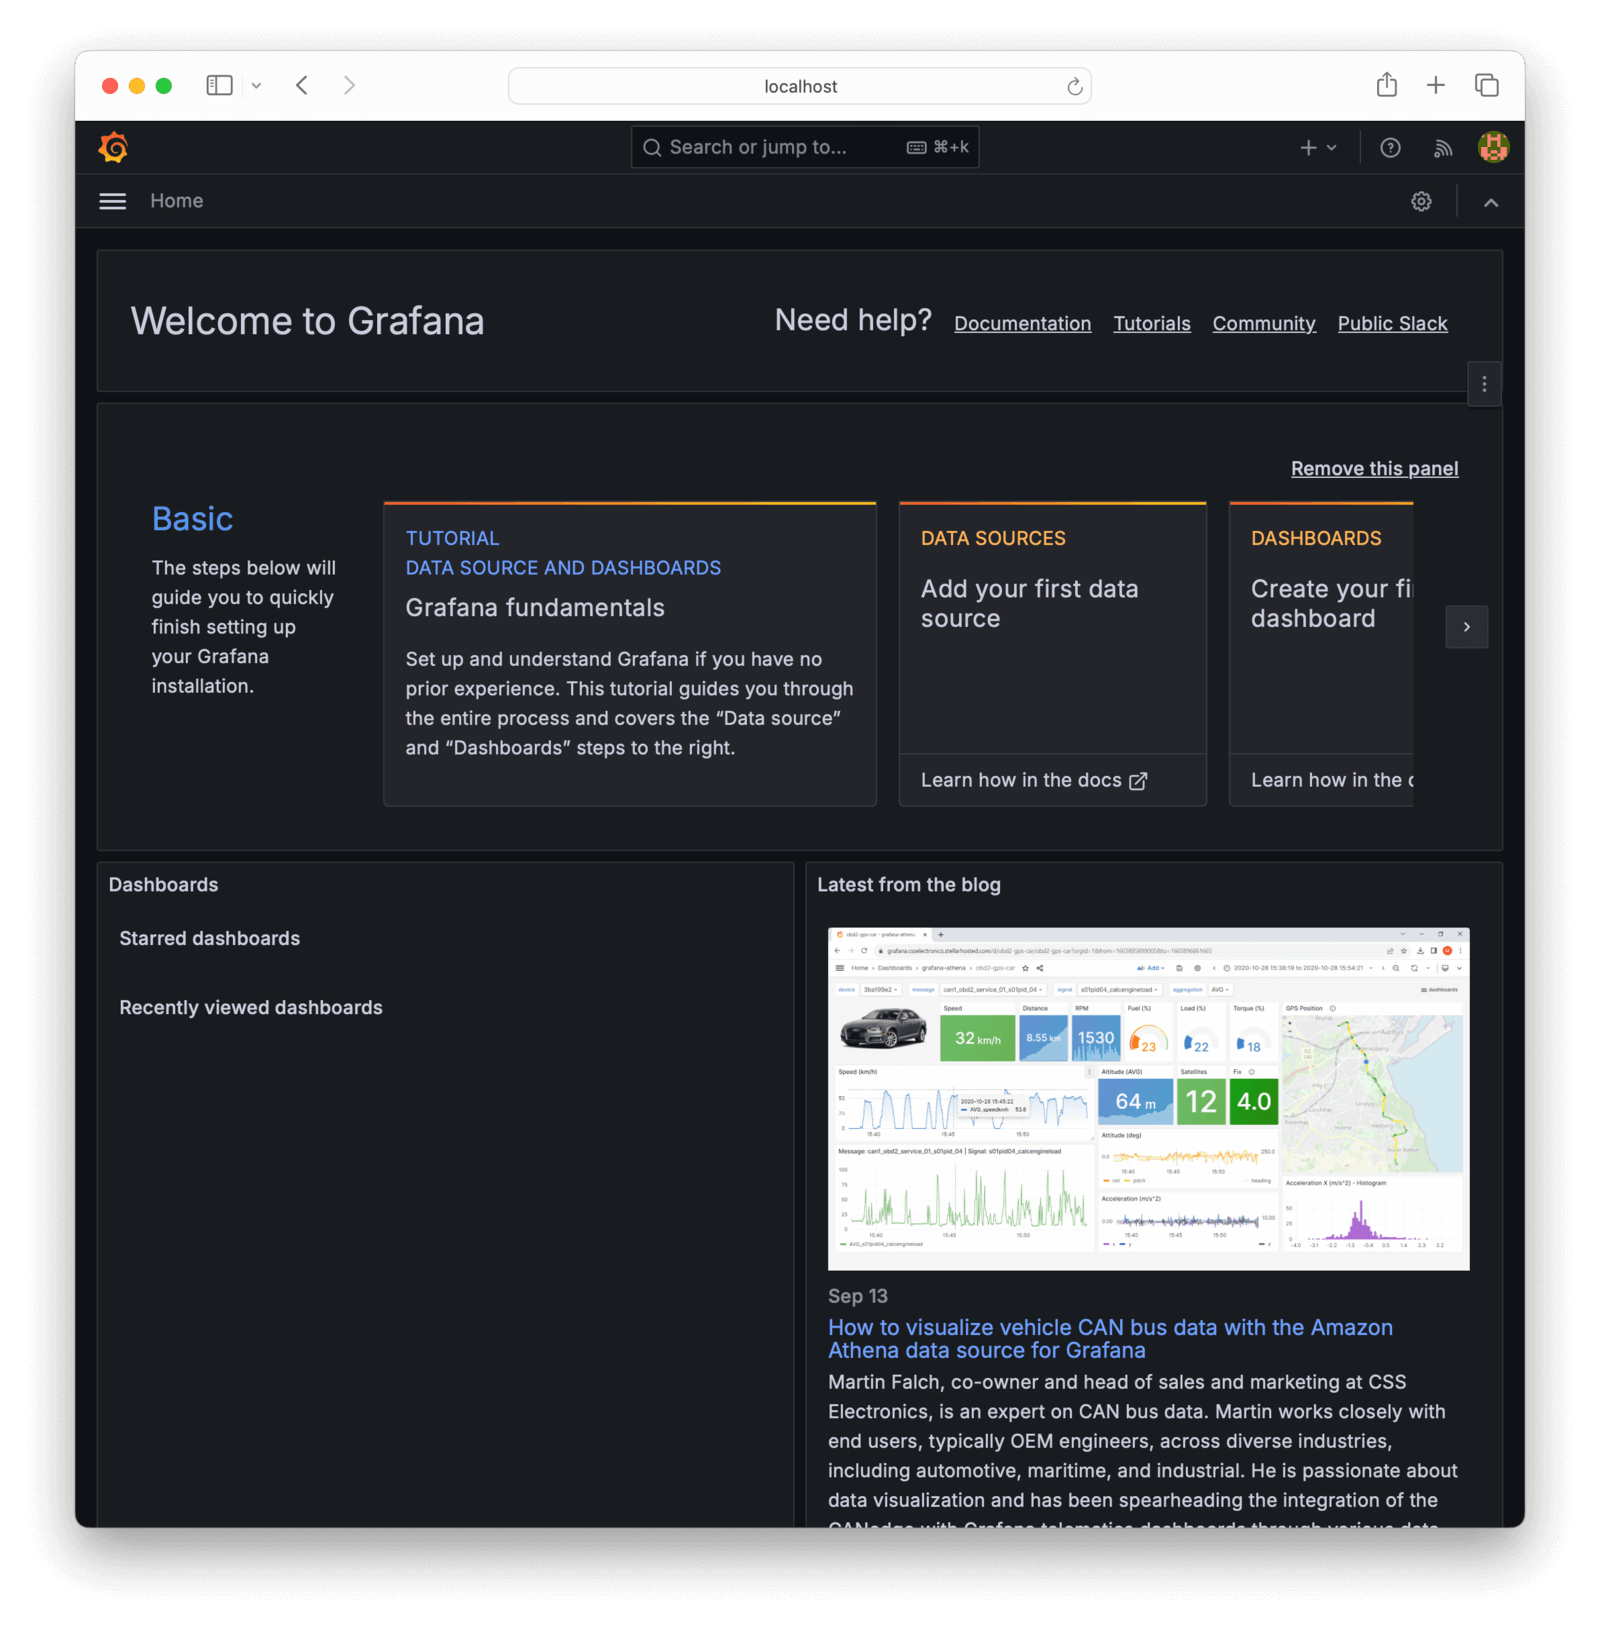
Log in to Grafana at http://localhost:9091 with username and password admin.
If you want to change the login settings in production, you can create the local file prometheusGrafanaConfig.ini with the example content below.
[security]
admin_user = admin2
Run docker exec -it faGraf /bin/bash to log in to the container and view sample files. For example, when in the container, run more /conf/sample.ini to see all configuration values. Lines starting with ; are commented out.
Add a dashboard in the Grafana web interface:
- Click Add your first data source in the center of the home page.
- Click Prometheus to add the default Prometheus connection.
- In the Prometheus Connection, enter the URL of the Docker container,
http://prometheus:9090. - Click Save & test . Grafana should now be able to connect to Prometheus. (Note that this connection retrieves the FusionAuth metrics, which is what we want, not metrics about Prometheus itself.)
- Click Dashboards in the sidebar, and then New dashboard on the right.
- Click Add visualization .
- Select prometheus as the data source.
- Enter the value
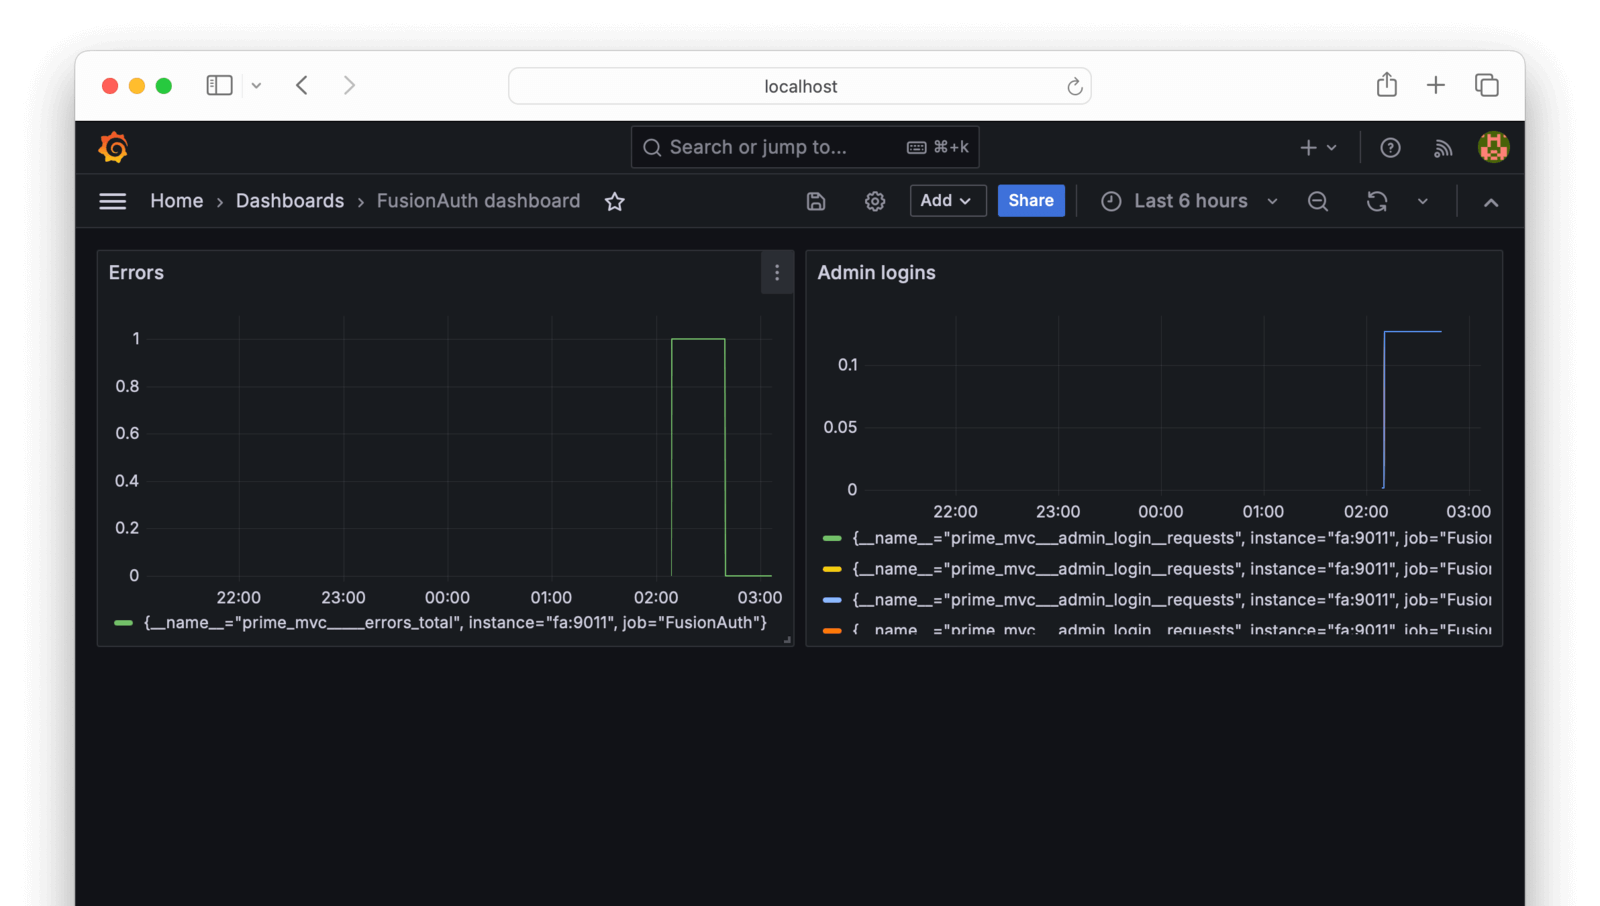
prime_mvc_____errors_totalin the Metric browser field at the bottom. Click Run queries , change the panel Title, and then click Apply to save the visualization. - Add another visualization with the value
prime_mvc___admin_login__requestsand save. - Save the dashboard and give it the name
FusionAuth dashboard. You can rearrange the charts if you would like to. The dashboard should look like the image below.
You can add any other metrics as visualizations. In the browser, search for metrics related to user login or oauth to keep track of how your system is used.
If you edit the dashboard as a whole, the JSON Model tab contains the full configuration text for your dashboard, which you can use in the provisioning files referred to earlier to automatically recreate the dashboard in a new instance of Grafana.
You can also create a new dashboard by importing a standard template from the Grafana repository. However, there is no FusionAuth template currently, and FusionAuth does not export all the Java metrics necessary to use the JVM template.
Store Logs In Loki#
The final monitoring component you might want to use is Grafana Loki for storing logs. Loki indexes only the metadata of a log line (its time, and attributes such as the server that sent it) and not its content. This is unlike Elasticsearch or OpenSearch, which index the log content, too. Loki therefore uses far less disk space than OpenSearch but is not quickly searchable. The no-indexing choice Loki made is better for most applications, where you need only to monitor logs for errors and store logs for auditing purposes, and don't need to run frequent queries against old logs.
Loki can run as a single app in a single Docker container or as separate components in multiple containers. In monolithic mode, Loki can handle up to 20 GB per day. This is enough for FusionAuth and is what you'll use in this guide.
Below is a diagram showing all the components Loki runs in a single container.

You can query logs in Grafana, or in the terminal with the Loki API or LogCLI.
Loki is primarily a log store, and will not fetch logs itself. Tools to send logs to Loki include Promtail (the original sending tool), OpenTelemetry, and Alloy (a new OpenTelemetry-compliant tool from Grafana). For more options, see the documentation. In this guide, you use Promtail for simplicity and stability.
When FusionAuth runs in Docker, it writes logs to the terminal and does not save them to a file or provide them via the API. This means that the logs are not available in the web interface.
To use Loki, add the services below to your docker-compose.yml file. You are now using Grafana images because Ubuntu has no images for Promtail.
  faLoki:
    image: grafana/loki:3.0.0
    container_name: faLoki
    ports:
      - 3100:3100
    volumes:
      - ./prometheusLoki/:/loki/
      - ./prometheusLokiConfig.yml:/etc/loki/local-config.yaml
    user: root
    environment:
      - target=all
    networks:
      - db_net


  faPromtail:
    image: grafana/promtail:3.0.0
    container_name: faPromtail
    depends_on:
      - faLoki
    volumes:
      - ./prometheusPromtailConfig.yml:/etc/promtail/config.yml
      - /var/run/docker.sock:/var/run/docker.sock
      - /var/lib/docker/containers:/var/lib/docker/containers
    networks:
      - db_net
The faLoki port 3100 is open so that Grafana can query it. The prometheusLoki volume persists log storage across container restarts. The prometheusLokiConfig.yml volume allows you to adjust Loki settings. Unlike the Ubuntu images, Grafana images don't use the root user. This means that the user in the container won't have permissions to create files on the Docker host machine. In production, you can inspect the running container to see what user it has, then create the prometheusLoki directory, and assign the directory owner as the container user. But for this prototype, it's faster to set the container user to user: root instead, so the container can directly write to the shared volume. The target=all configuration runs the Loki container in monolithic mode.
The faPromtail service waits for Loki to start by using depends_on: faLoki. The service has volumes for a configuration file and for access to the log files saved by Docker and the Docker socket file.
Use the code below to change the fa service to make FusionAuth wait for Promtail to run before FusionAuth starts. If FusionAuth isn't configured to wait, Loki will not record potential FusionAuth starting errors.
    depends_on:
      faPromtail:
        condition: service_started
      fa_db:
        condition: service_healthy
You can comment out the prometheusLokiConfig.yml volume in the faLoki service configuration to use default values. The default values are fine. But if you want to use Loki with Alertmanager, you should create the file with the contents below (where only the last line differs from the default). Below, the Alertmanager URL now points to the Docker service for the ruler (rules manager).
auth_enabled: false

server:
  http_listen_port: 3100

common:
  instance_addr: 127.0.0.1
  path_prefix: /loki
  storage:
    filesystem:
      chunks_directory: /loki/chunks
      rules_directory: /loki/rules
  replication_factor: 1
  ring:
    kvstore:
      store: inmemory

schema_config:
  configs:
    - from: 2020-10-24
      store: tsdb
      object_store: filesystem
      schema: v13
      index:
        prefix: index_
        period: 24h

ruler:
  alertmanager_url: http://alertmanager:9093
The prometheusPromtailConfig.yml file controls which containers Promtail will get logs from. It is documented here. Create the prometheusPromtailConfig.yml file and add the content below.
server:
  http_listen_port: 9080
  grpc_listen_port: 0

clients:
  - url: http://faLoki:3100/loki/api/v1/push

scrape_configs:
  - job_name: docker
    docker_sd_configs:
      - host: unix:///var/run/docker.sock
        refresh_interval: 15s
        filters:
          - name: name
            values: [^fa$]
    relabel_configs:
      - source_labels: ['__meta_docker_container_name']
        regex: '/(.*)'
        target_label: 'container'
The clients URL points to the Loki Docker service where Promtail will send logs. The scrape_configs section describes how Promtail will get logs.
The docker_sd_configs configuration option is one way for Promtail to get logs (along with local file logs and Kubernetes). It follows the Prometheus configuration format, which uses the Docker container reference format.
The filters section excludes all containers from having their logs stored other than FusionAuth, which has the regular expression container name ^fa$ (start, fa, end). There is no / in this name. If you instead used a filter of fa, the logs of fa_db would also be stored.
The relabel_configs section maps the Docker container name to the logs container metadata, so you can search for it when querying the logs. Note that while your container and service name in the Docker process list is fa, the name exposed in the Docker API is actually /fa. You can see the / used in the regex above. To see this is true in Docker, run docker inspect fa. You'll see the container name is actually "Name": "/fa".
Log monitoring is ready. Run docker compose up to start all monitoring components. Browse to http://localhost:3100/ready to check that Loki is up.
To view the logs in Grafana:
- Browse to Grafana and choose Connections -> Data sources in the sidebar.
- Choose Add new data source and select Loki .
http://faLoki:3100in the URL field - this is the only setting to change.- Click Save and test . If Grafana cannot detect Loki, check that your URL matches the one in your Docker Compose file and that there are no errors in the Docker terminal.
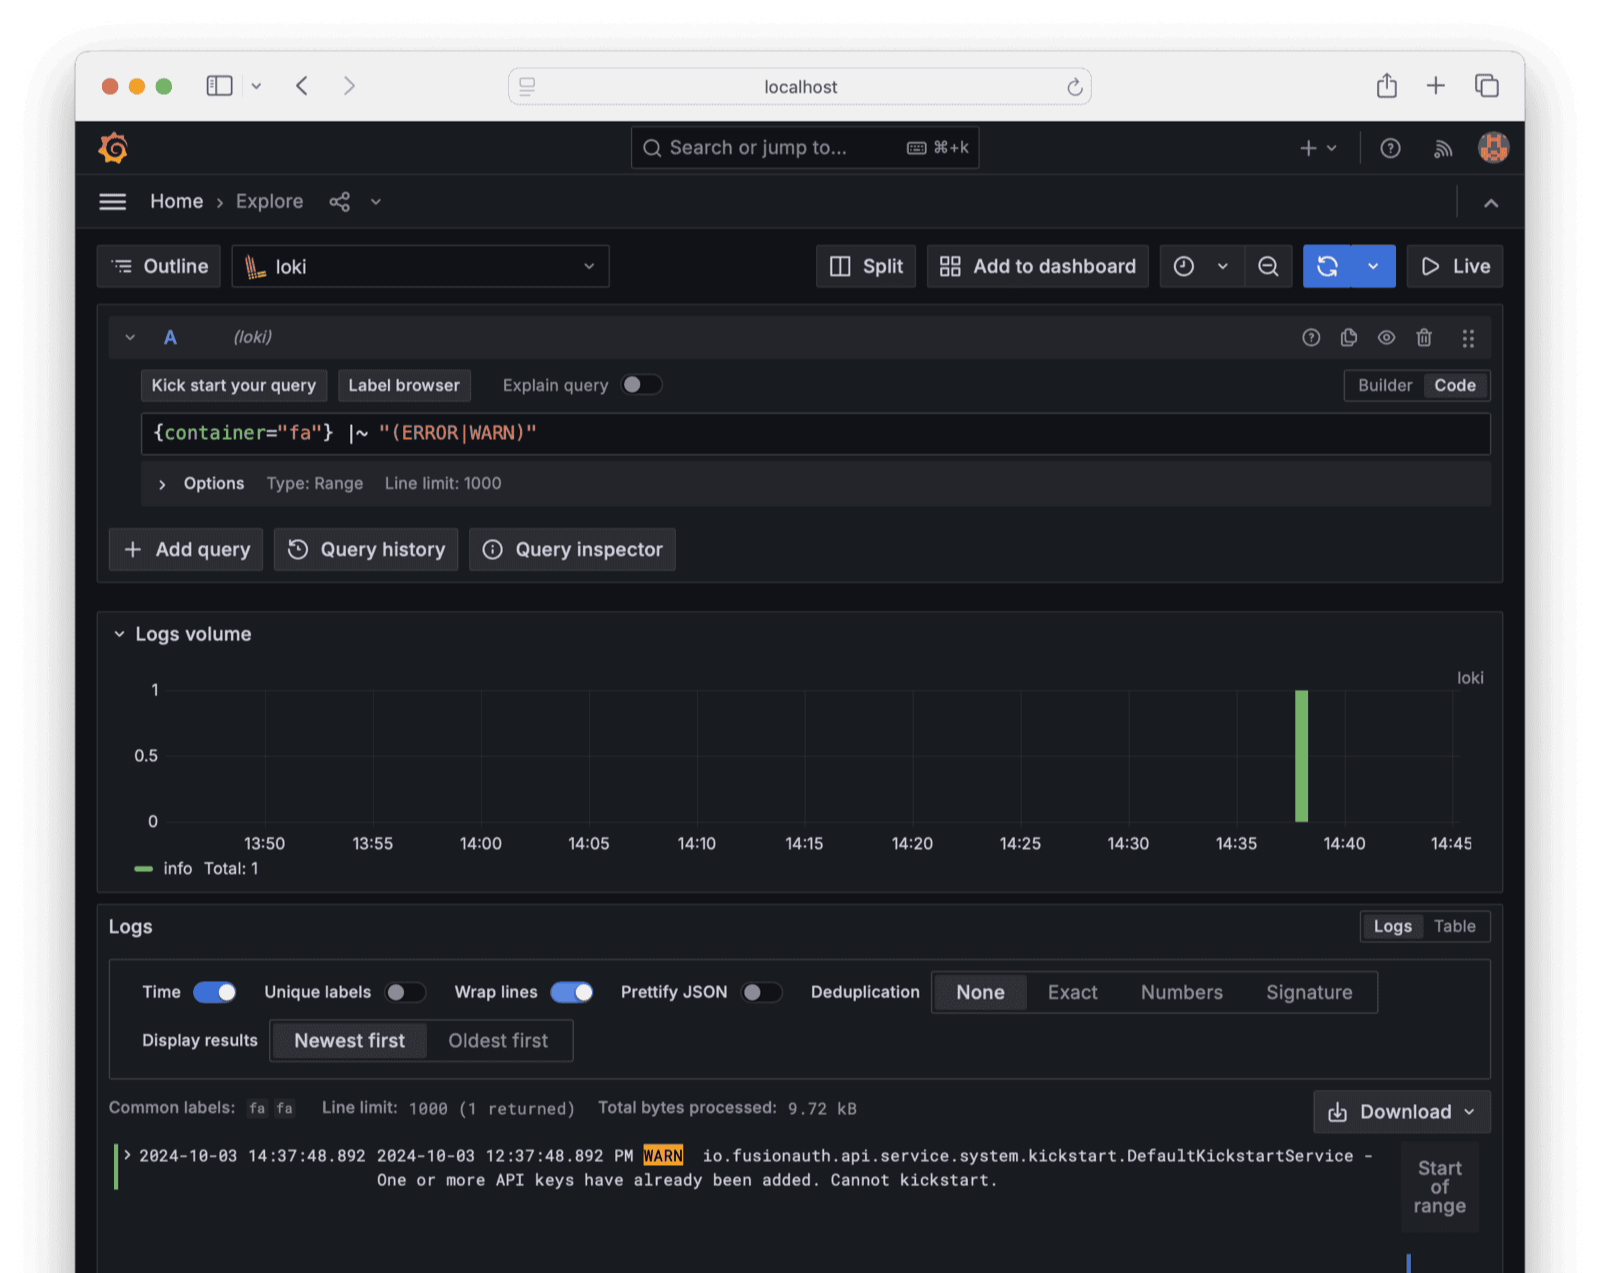
- Click Explore in the sidebar to start browsing your Loki logs.
- Choose Loki as your data source and enter a query value of
{container="fa"}. - Press Run query to view the logs.
You can filter logs and make complex queries. For example, try {container="fa"} |~ "(ERROR|WARN)".
Now that Loki stores FusionAuth logs, you can add log widgets to your Grafana dashboard, and use either Grafana or Loki directly to send alerts to Alertmanager.
Next Steps#
In addition to monitoring the Prometheus metrics provided by FusionAuth, you might want to know various custom metrics, such as user login rates and successes. To do this, read the FusionAuth guide to OpenTelemetry and how to use it to create a bash script to collect any metric the FusionAuth API offers.
Final System Architecture#
If you combine the Prometheus, Alertmanager, Grafana, Loki, and ntfy infrastructure shown in this guide, your architecture will be as follows.
graph LR
  D(User)
  N(Ntfy.sh)
  subgraph I[Your server]
    subgraph G[Docker]
      H[(PostgreSQL)]
    end
    subgraph C[Docker]
      A(FusionAuth)
    end
    subgraph E[Docker]
      B(Prometheus)
    end
    subgraph K[Docker]
      L(AlertManager)
    end
    subgraph P[Docker]
      Q(Loki)
    end
    subgraph R[Docker]
      S(Promtail)
    end
    subgraph J[Docker]
      F(Your app)
    end
    subgraph M[Docker]
      O(Grafana)
    end
  end
  D --> J
  D --> C
  C --> G
  F --> C
  E --> C
  E --> K
  K --> N
  M --> E
  E --> |Prometheus reads Loki logs| P
  R --> |Promtail reads FusionAuth logs| C
  R --> |Promtail sends logs to Loki| P
  M --> |Grafana queries Loki logs| P
  style I fill:#999
  style E fill:#944
  style K fill:#944
  style N fill:#944
  style M fill:#944
  style P fill:#944
  style R fill:#944