Datadog
Datadog is an observability service you can integrate with your FusionAuth applications to collect events and metrics so that you can analyze the monitoring and performance data.
This guide will show you how to connect FusionAuth to Datadog, including instructions for:
- Setting up Prometheus API access in FusionAuth.
- Setting up your Datadog account.
- Adding a Datadog Agent to a FusionAuth Docker image to collect and export telemetry data.
- Creating a dashboard in Datadog to monitor FusionAuth metrics.
- Installing the Datadog Agent on a remote host to monitor the Prometheus endpoint exposed by FusionAuth.
- Setting up an OpenTelemetry Linux collector to receive, process, and export telemetry data.
- Adding export logs or events with a Python app using the Datadog API.
Look at the FusionAuth guide to monitoring to get an overview of available metrics and choose the ones relevant to your needs. For an overview of the metrics you can collect with Datadog, review the Datadog and OpenTelemetry in Datadog documentation.
Set Up Prometheus API Access In FusionAuth#
FusionAuth exposes metrics on a Prometheus endpoint. To use the endpoint, generate an API key in FusionAuth and grant it access to perform GET requests on the endpoint:
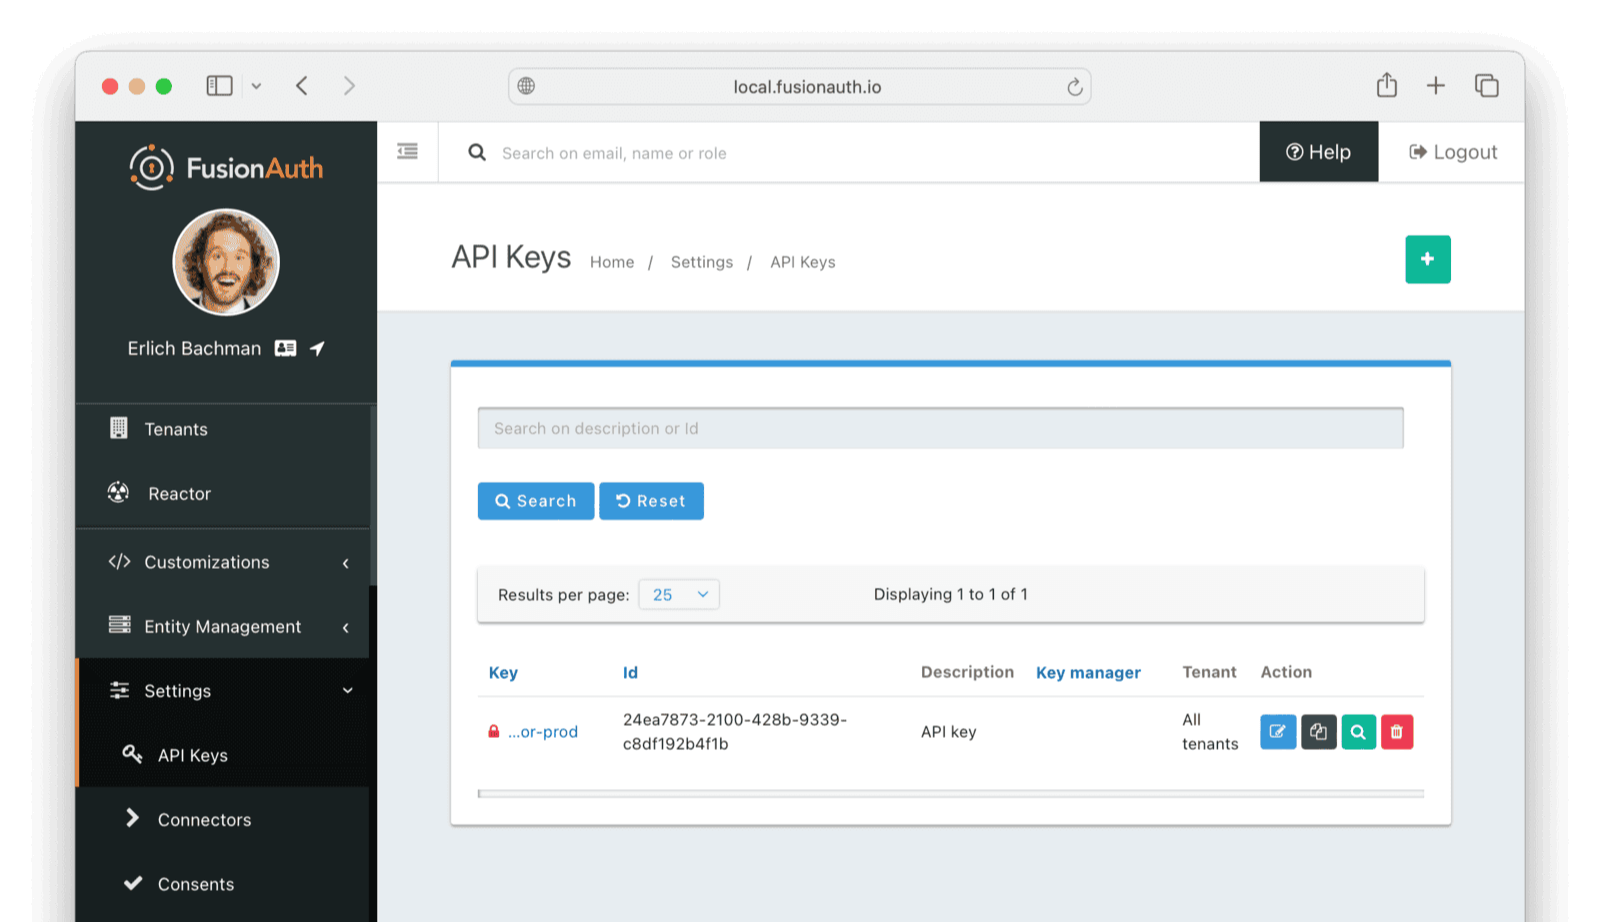
- Log in to your FusionAuth instance and navigate to Settings -> API keys .
- On the top-right of the page, click the button to add a new API key.
- Enter a Description for the API key.
- Scroll down and enable GET permission on the
/api/prometheus/metricsendpoint.
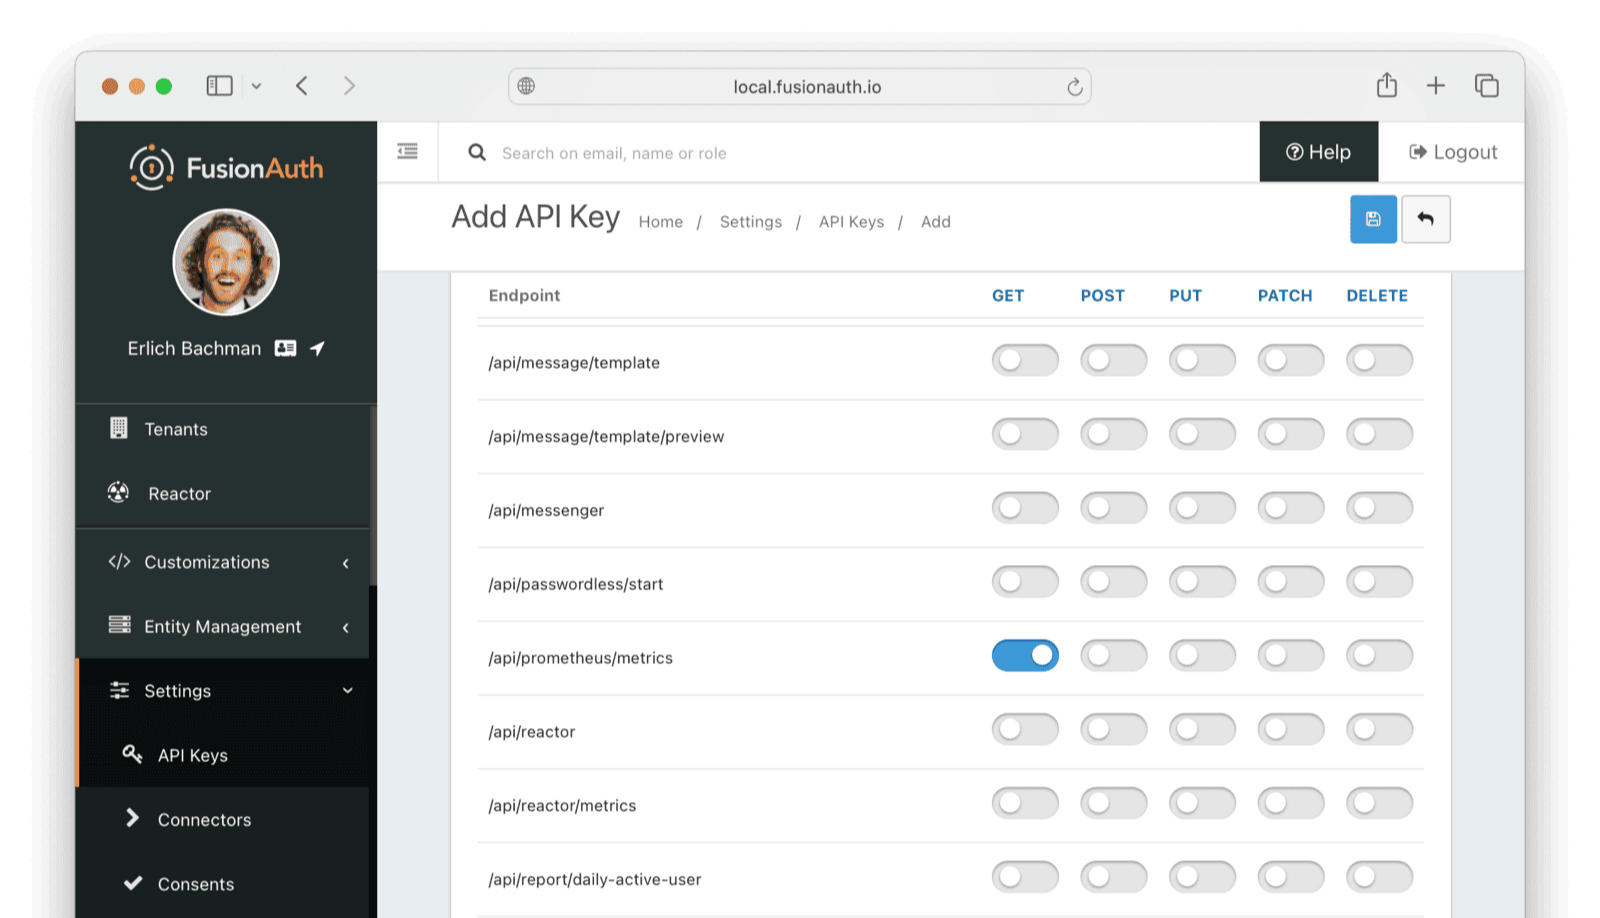
- Click the button to save the API key.
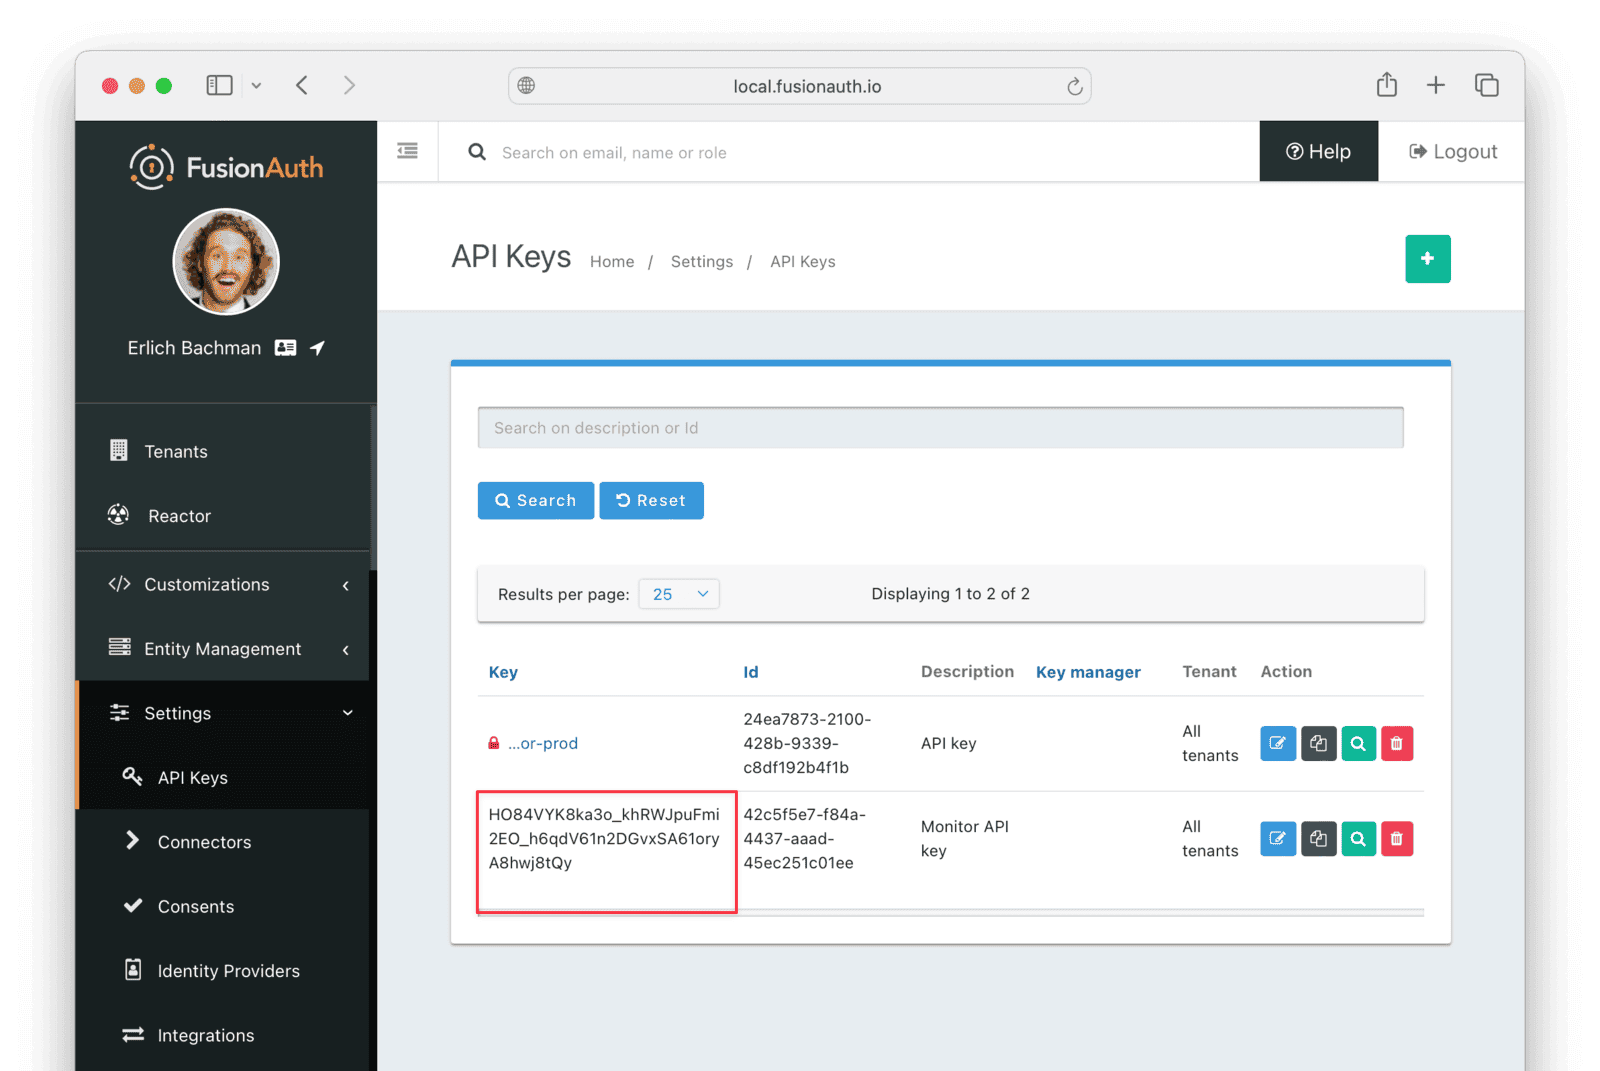
On the API Keys list page, click the red lock next to the newly generated key to reveal the key value. Copy and store this key, as you will need it later in the guide.
Set Up A Datadog Account#
Navigate to Datadog and log in. If you don't already have a Datadog account, click GET STARTED FREE to complete the registration form and start a 14-day trial.
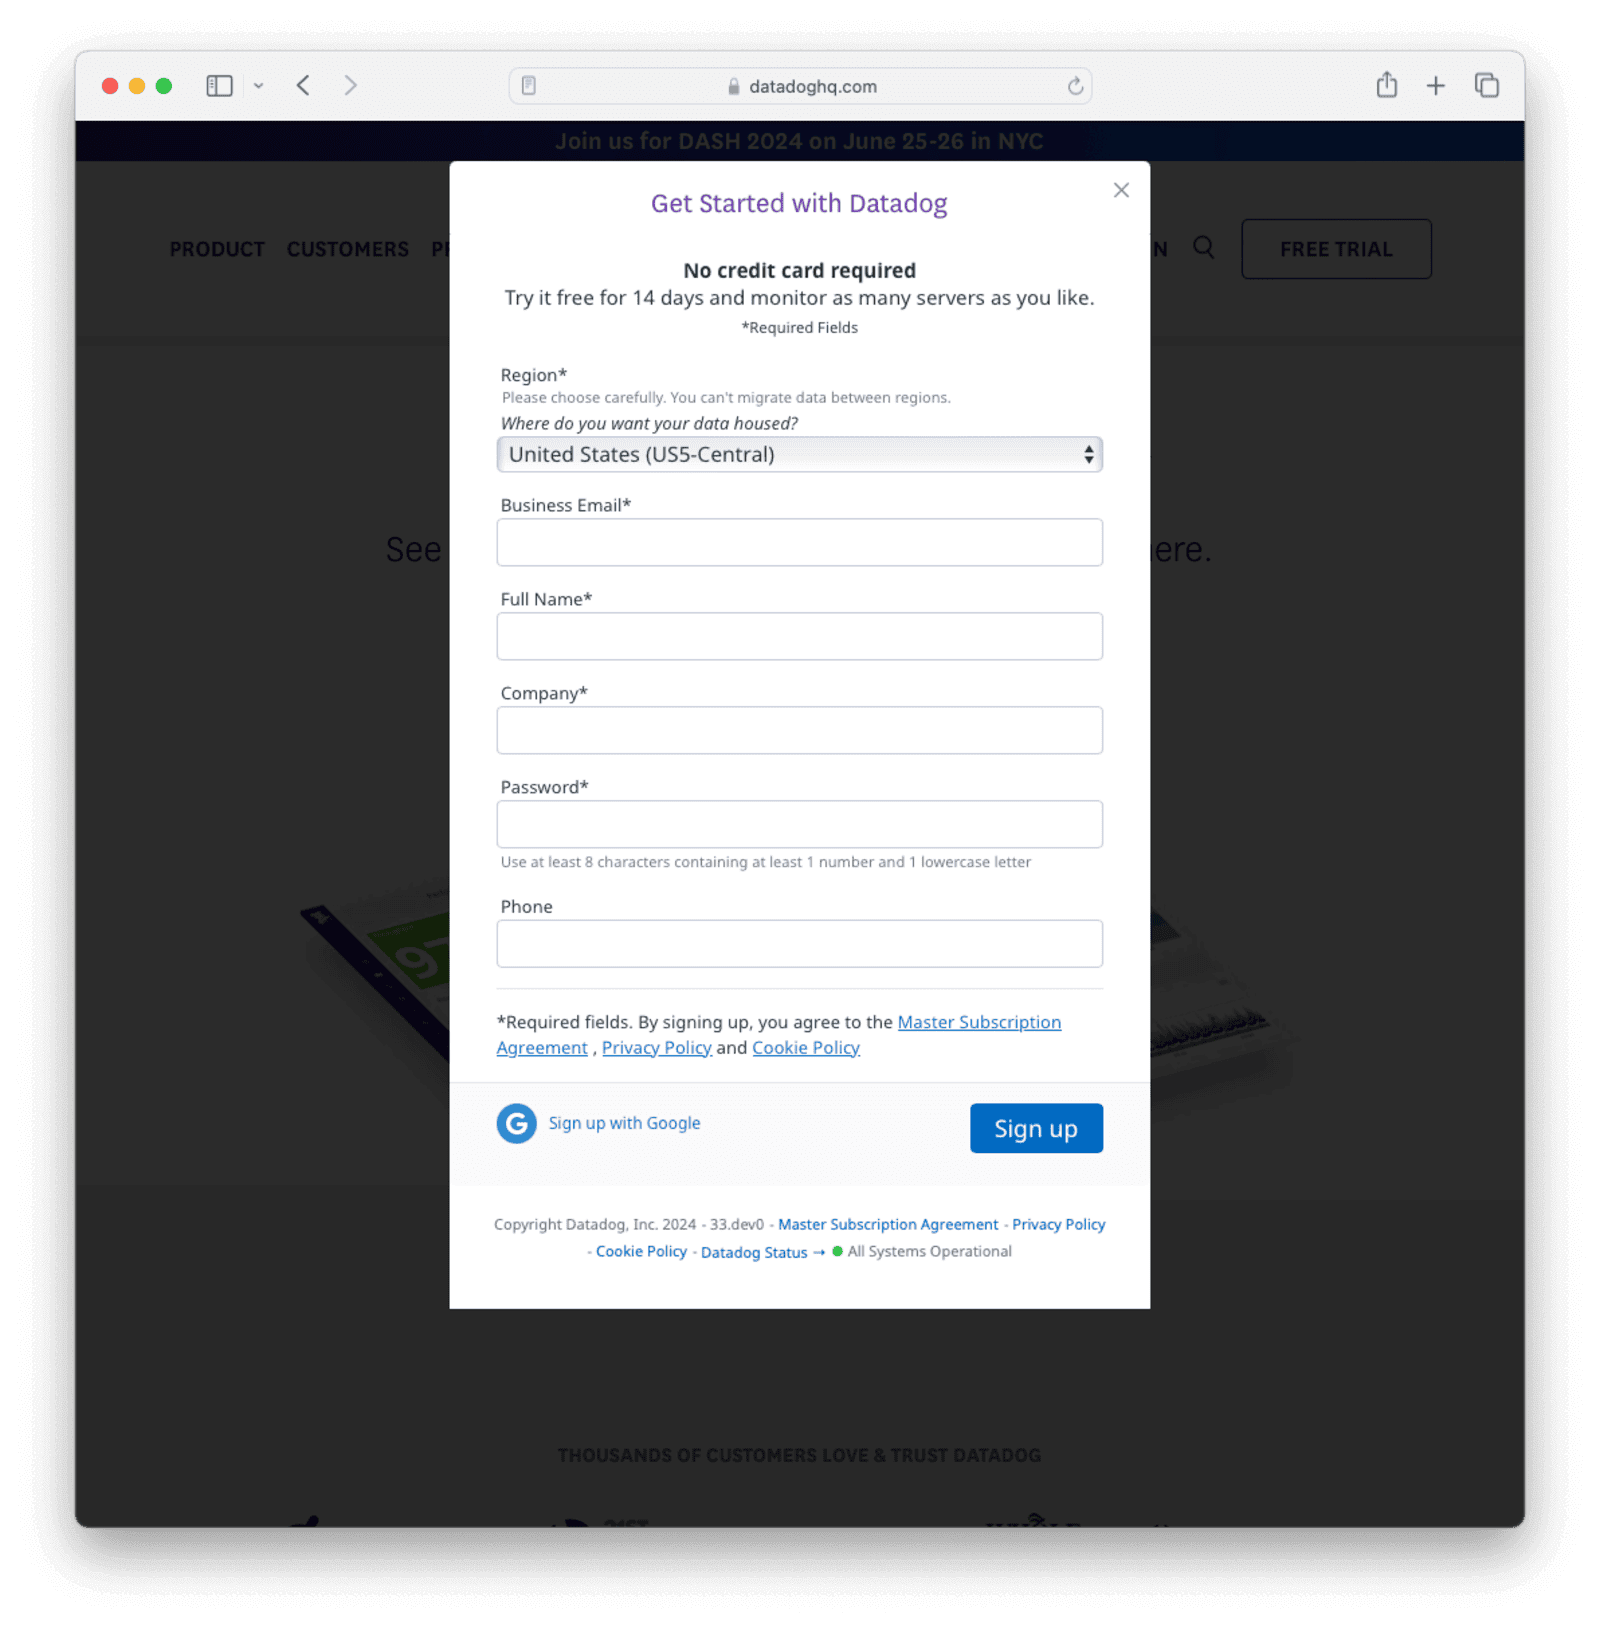
Note the hosting Region, as this will determine the URL you use later to connect to Datadog. This guide uses the United States (US5-Central) region (us5.datadoghq.com).
You can optionally give Datadog information about your stack on the Your Stack tab.
The Datadog Agent collects metrics and events from your system and apps and can be installed anywhere, even on your workstation.
On the Agent Setup tab in Datadog, select your platform from the list on the left for installation instructions. For example, if you select Ubuntu, it will show the command to install the agent on Ubuntu using a script.
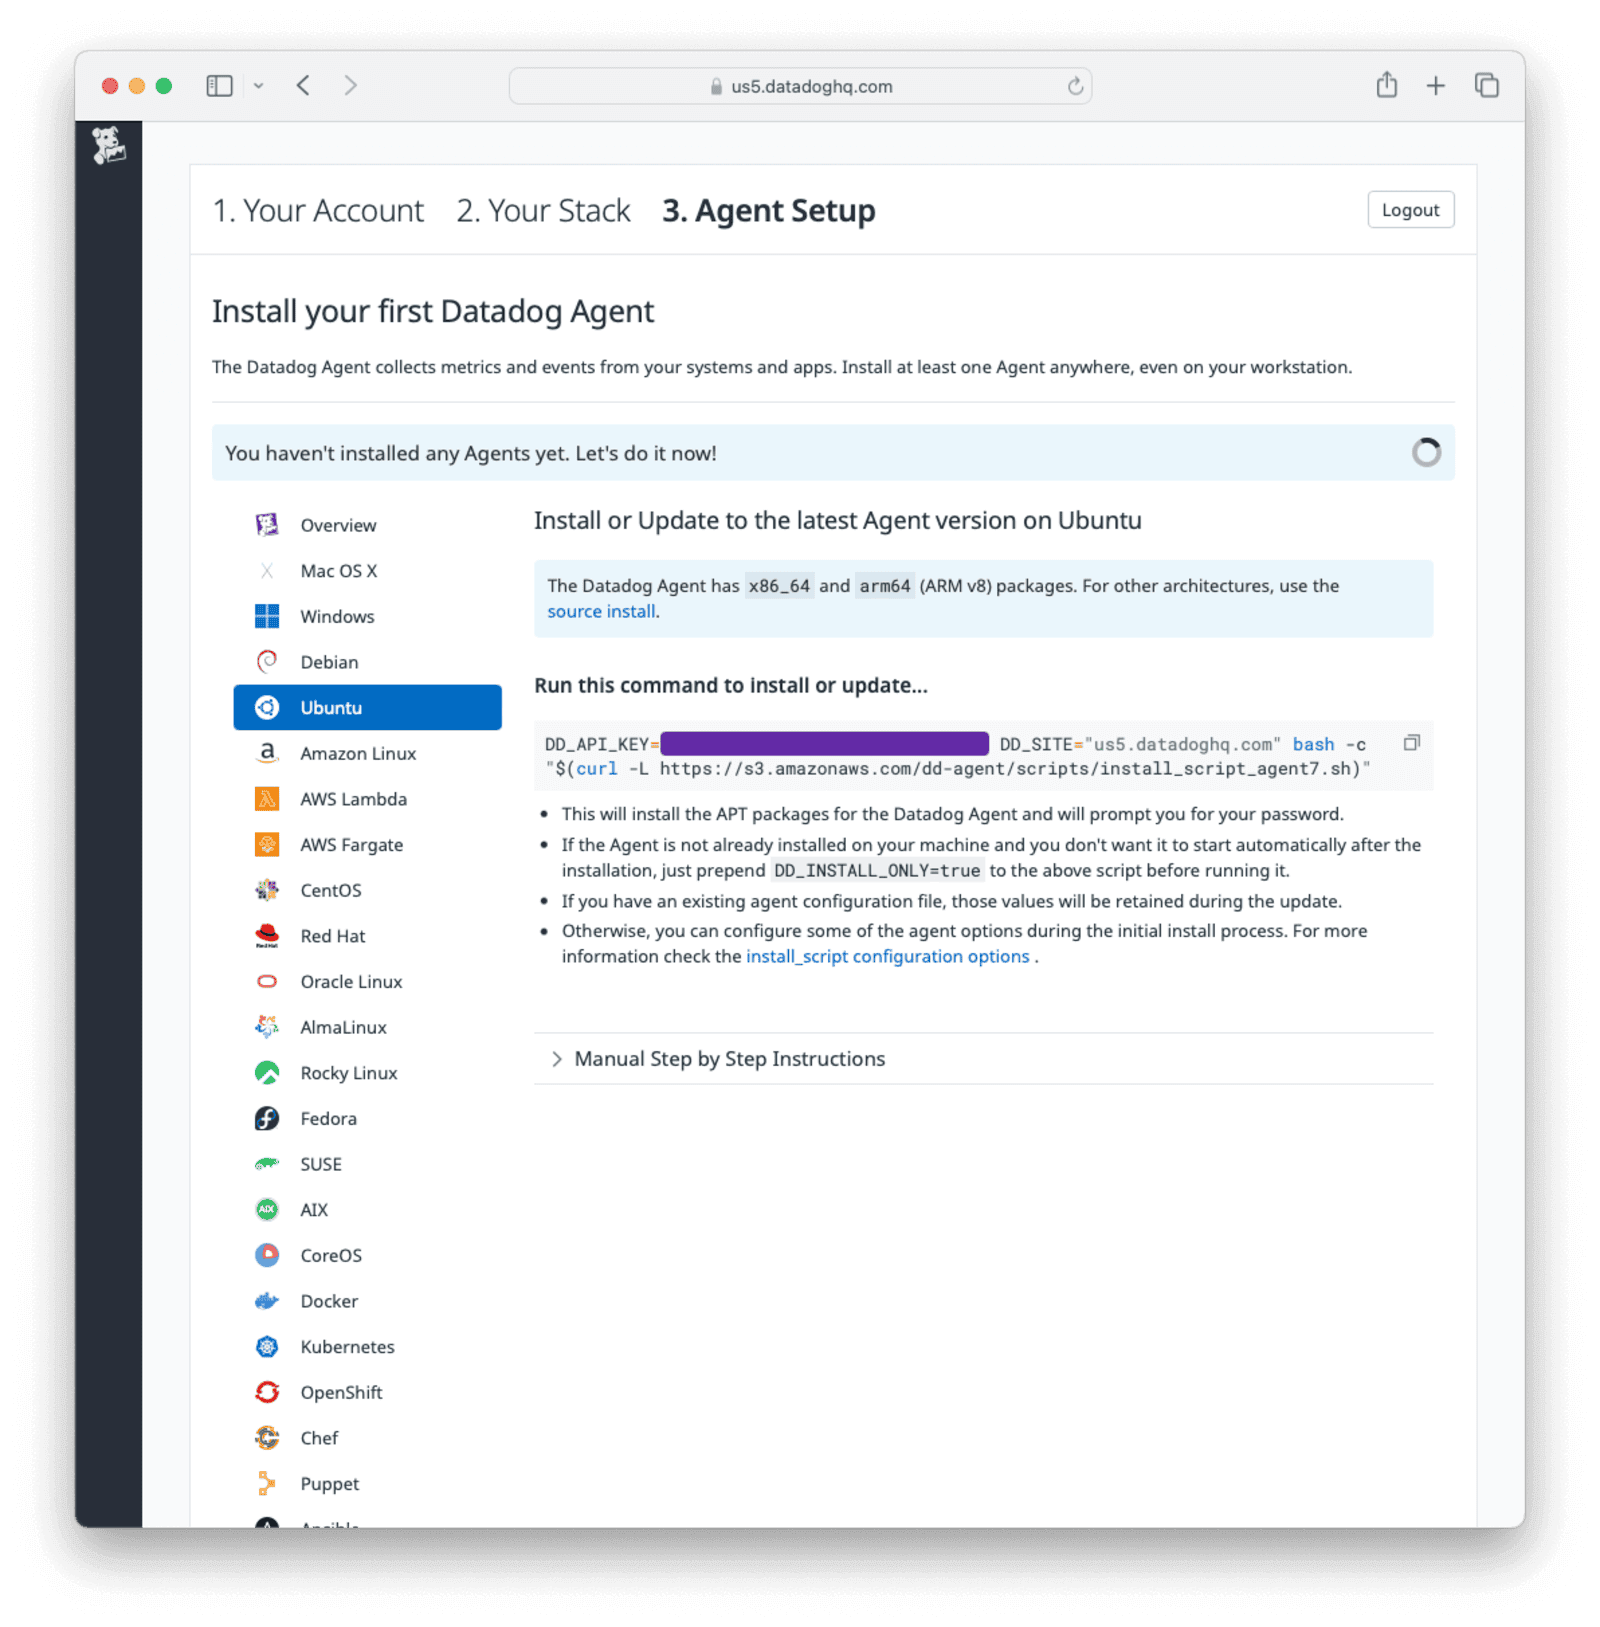
Copy your Datadog API key value from the DD_API_KEY field in the installation command and save it to use later.
If you prefer to manually install the agent, expand the Manual Step by Step Instructions accordion.
Set Up The Datadog Agent Using Docker#
Now you will build a FusionAuth Docker image that has the Datadog Agent installed using the installation command from the instructions page.
First, save the Dockerfile from the FusionAuth containers repo to your computer. Edit the Dockerfile file and insert the following lines above the comment "###### Start FusionAuth App".
### New for Datadog ###
RUN mkdir -p /var/lib/apt/lists/partial \
&& chmod 755 /var/lib/apt/lists/partial \
&& apt update \
&& apt install -y ca-certificates curl  sudo \
&& cd /usr/local/fusionauth \
&& curl -L -o install_script_agent7.sh https://s3.amazonaws.com/dd-agent/scripts/install_script_agent7.sh \
&& chmod +x /usr/local/fusionauth/install_script_agent7.sh

### Install Datadog Agent app ###
ENV DD_API_KEY="<your API key from Datadog website>"
ENV DD_SITE="us5.datadoghq.com" #<Your Datadog site domain>
ENV DD_INSTALL_ONLY=false
ENV DD_HOSTNAME="fusionauthdocker"
RUN /bin/bash -c "/usr/local/fusionauth/install_script_agent7.sh"

### Copy the OpenMetrics configuration file ###
COPY openmetrics.d-conf.yaml /etc/datadog-agent/conf.d/openmetrics.d/conf.yaml

# Allow FusionAuth user to run Datadog agent service without password
RUN echo "fusionauth ALL=(ALL) NOPASSWD: /usr/sbin/service datadog-agent start" > /etc/sudoers.d/fusionauth

# Ensure correct ownership and permissions for the log directory
RUN mkdir -p /usr/local/fusionauth/logs \
    && chown -R fusionauth:fusionauth /usr/local/fusionauth/logs

## Modify FusionAuth start script to start Datadog Agent as root and continue on failure
# RUN head -n -1 /usr/local/fusionauth/fusionauth-app/bin/start.sh > temp.sh \
# && echo 'sudo service datadog-agent start <&- >>  /dev/null' >> temp.sh \
# && mv temp.sh /usr/local/fusionauth/fusionauth-app/bin/start.sh \
# && chown fusionauth:fusionauth /usr/local/fusionauth/fusionauth-app/bin/start.sh \
# && chmod +x /usr/local/fusionauth/fusionauth-app/bin/start.sh
This configuration downloads the Datadog Agent installation script from https://s3.amazonaws.com/dd-agent/scripts/install_script_agent7.sh and sets the environment variables to complete the installation. Once the Datadog Agent is installed, the config openmetrics.d-conf.yaml is copied into the image to handle the OpenMetrics integration.
Now create an openmetrics.d-conf.yaml file in the same folder as the Dockerfile and add the following configuration to it:
init_config:

instances:
 - prometheus_url: http://localhost:9011/api/prometheus/metrics
   namespace: FusionAuth_docker_metrics_openmetric_agent
   metrics:
     - '*'
   headers:
     Authorization: '<Your FusionAuth API key with access to Prometheus metrics>'
Content-Type: 'application/json'If you have restarted your FusionAuth instance, you need to regenerate the API key using the steps outlined in the Set Up Prometheus API Access In FusionAuth section.
Build the Dockerfile into a new image to use in place of the official FusionAuth image.
docker build --platform linux/amd64 -t faimage .Save the docker-compose.yaml and sample .env files from the FusionAuth containers repo.
In the docker-compose.yaml file, change the line image: fusionauth/fusionauth-app:latest to point to the image you have just built image: faimage:latest.
To start the services, run the following command in the terminal you used to save the docker-compose.yaml file.
docker compose up -dThe code to autostart the datadog-agent is commented out in the sample Dockerfile configuration because the current version of the agent gives a fail message when it starts, although it starts successfully. This prevents FusionAuth from starting in the Docker container. You need to start the agent manually when FusionAuth is running with the following commands.
  docker ps   # to get the ID of the FusionAuth container which should look something like d5a0c674288a

  docker  exec -u root -it d5a0c674288a service datadog-agent start  #start the agent

  docker  exec -u root -it d5a0c674288a service datadog-agent status #get the service status should respond with  * datadog-agent is running
When the agent is successfully installed and started in the FusionAuth container, refresh the window on the Datadog website, and it will indicate that metrics from the agent are being received.
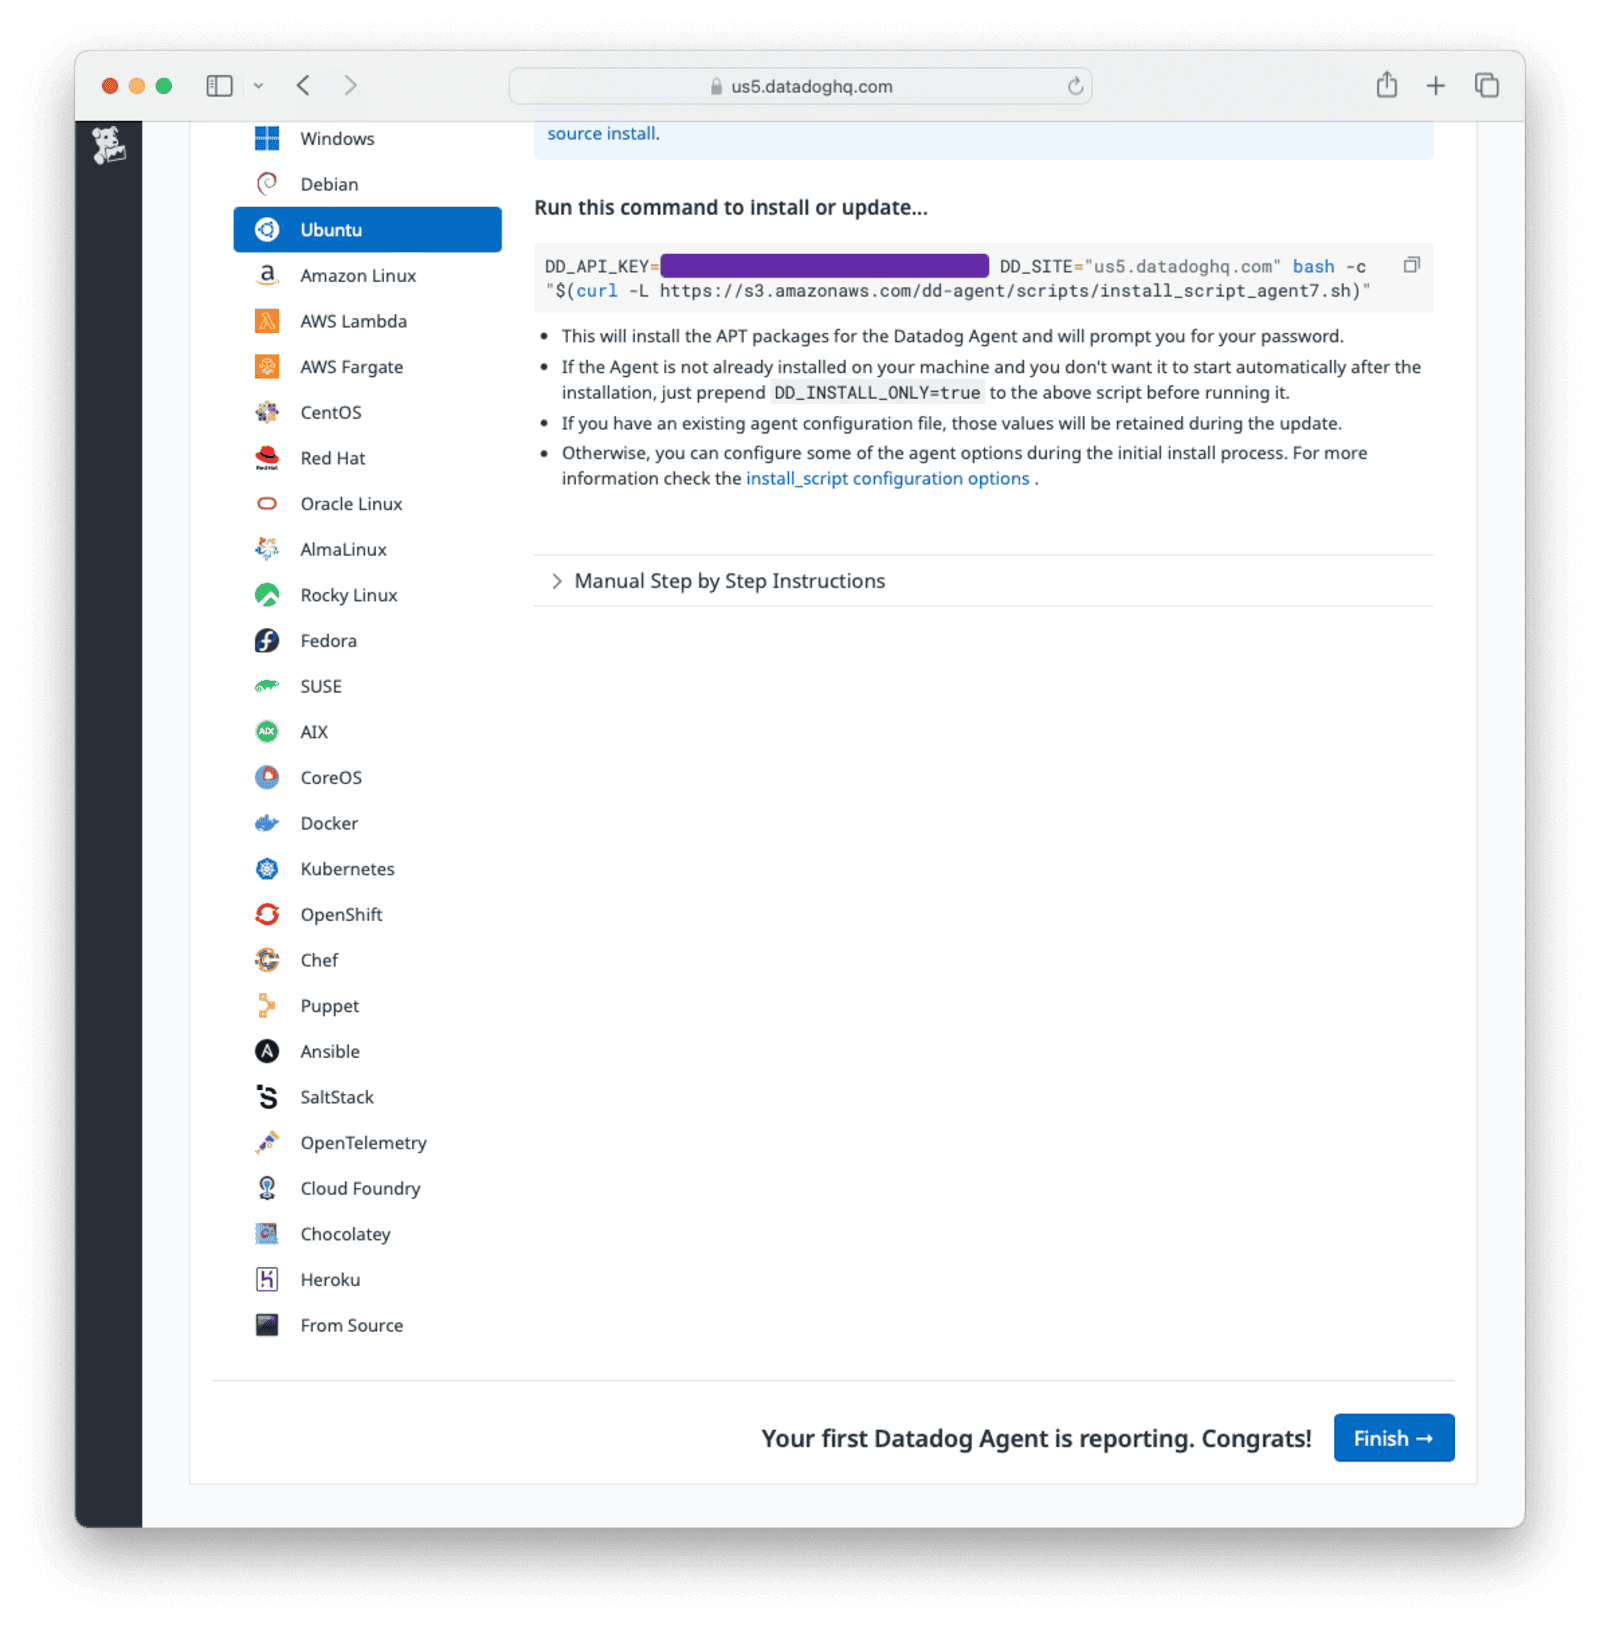
Click on Finish to continue.
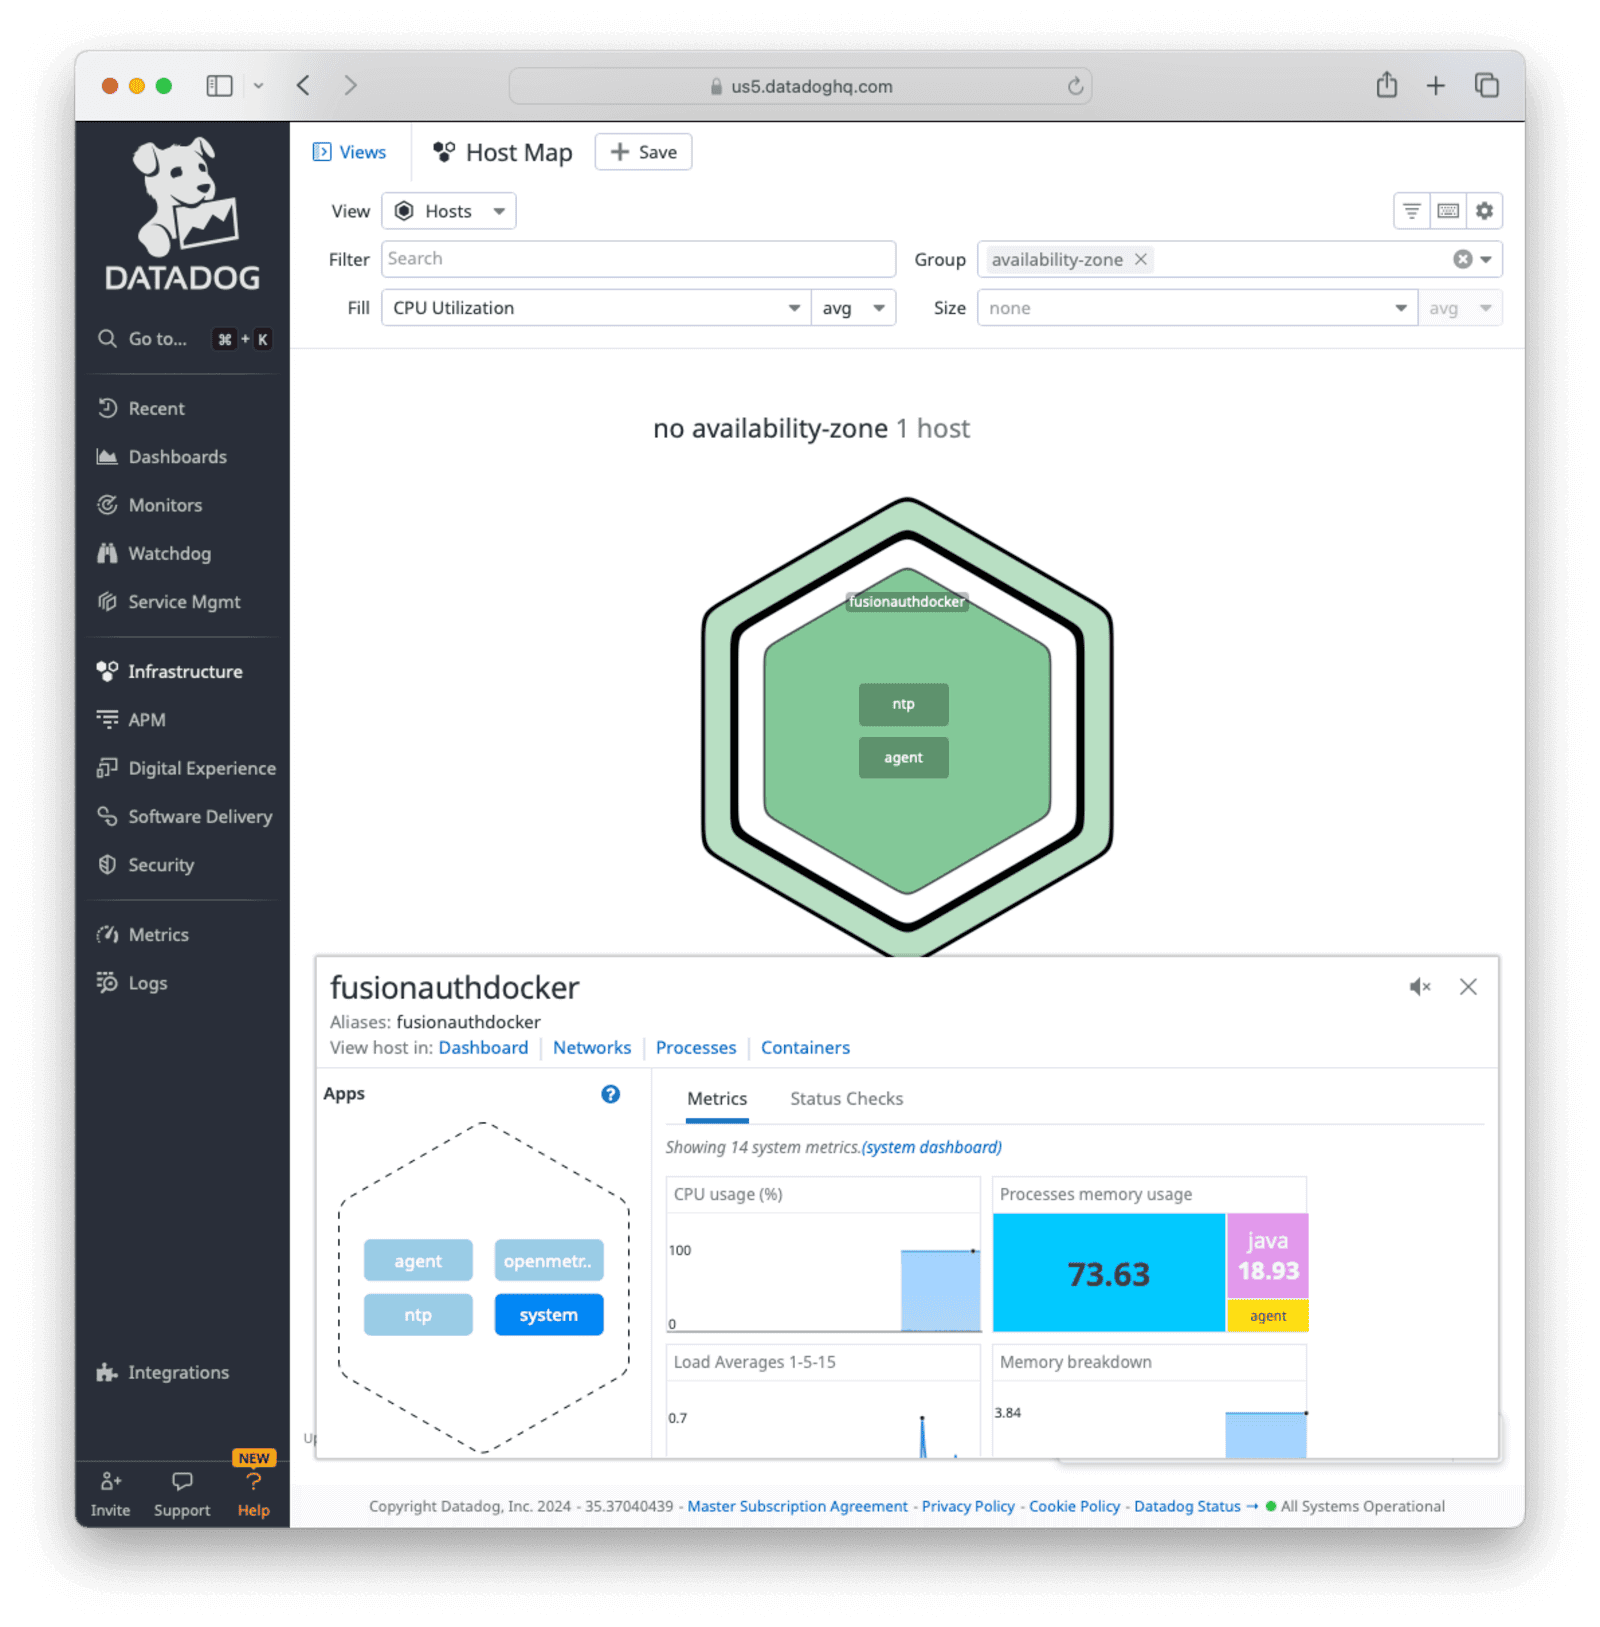
You can view all registered hosts by navigating to Infrastructure -> Host Map . Click the agent block for a registered host to view metrics received.
Set Up A Datadog Dashboard#
Let's create a dashboard on Datadog to visualize the data received from FusionAuth.
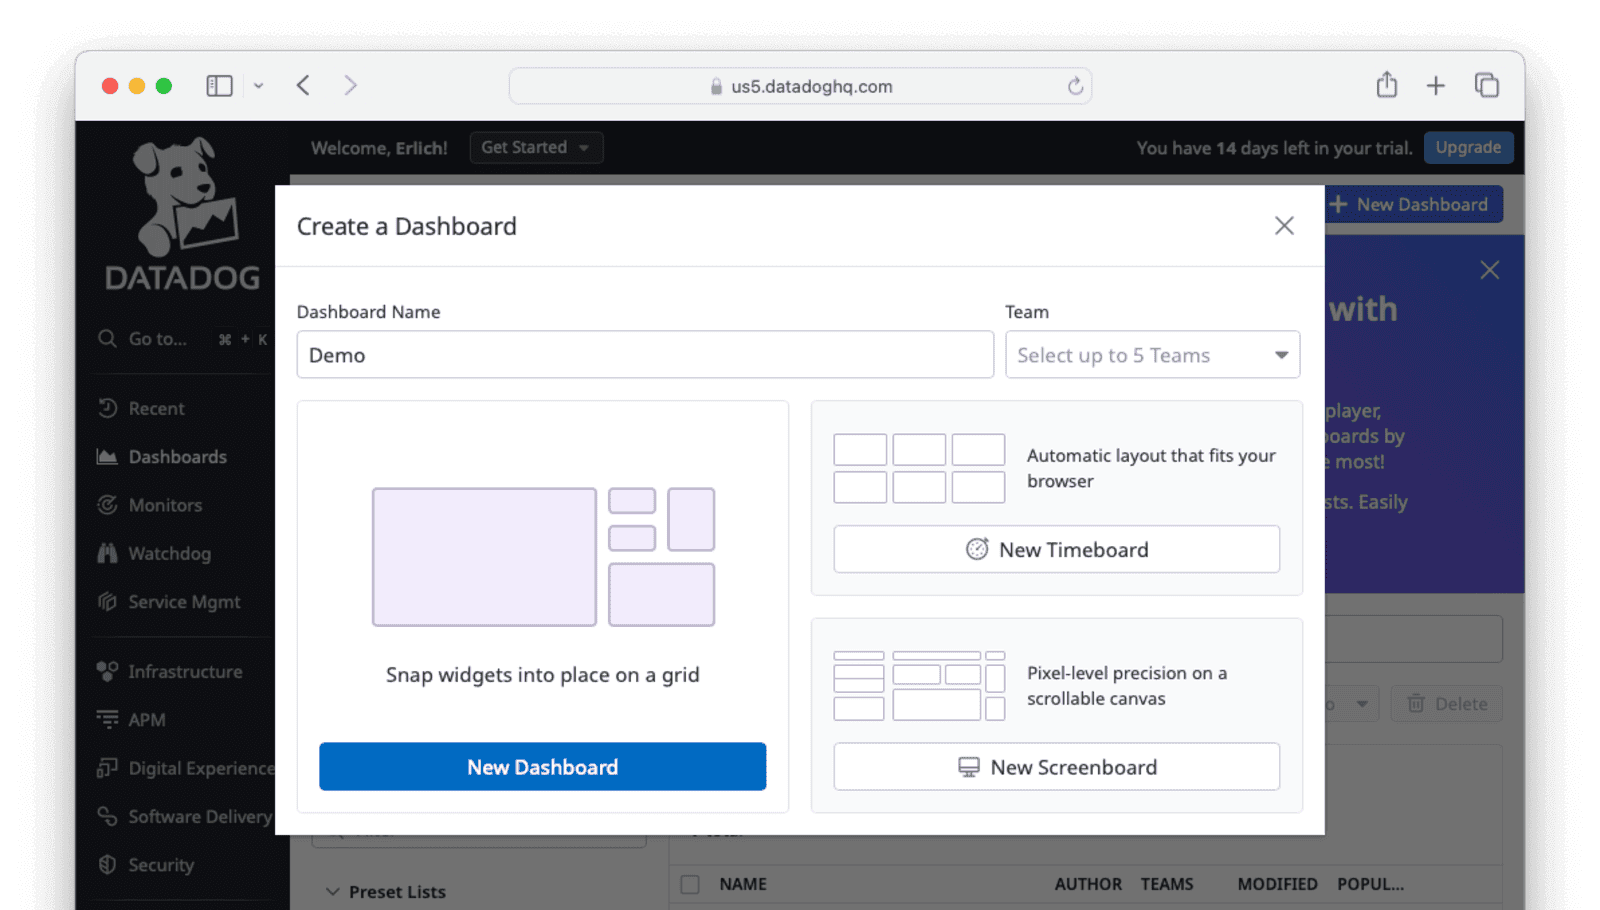
In the Datadog UI, navigate to Dashboards -> New Dashboard . Give the dashboard a Name. If you have organizations configured, you can select a Team.
Click on New Dashboard to create the dashboard.
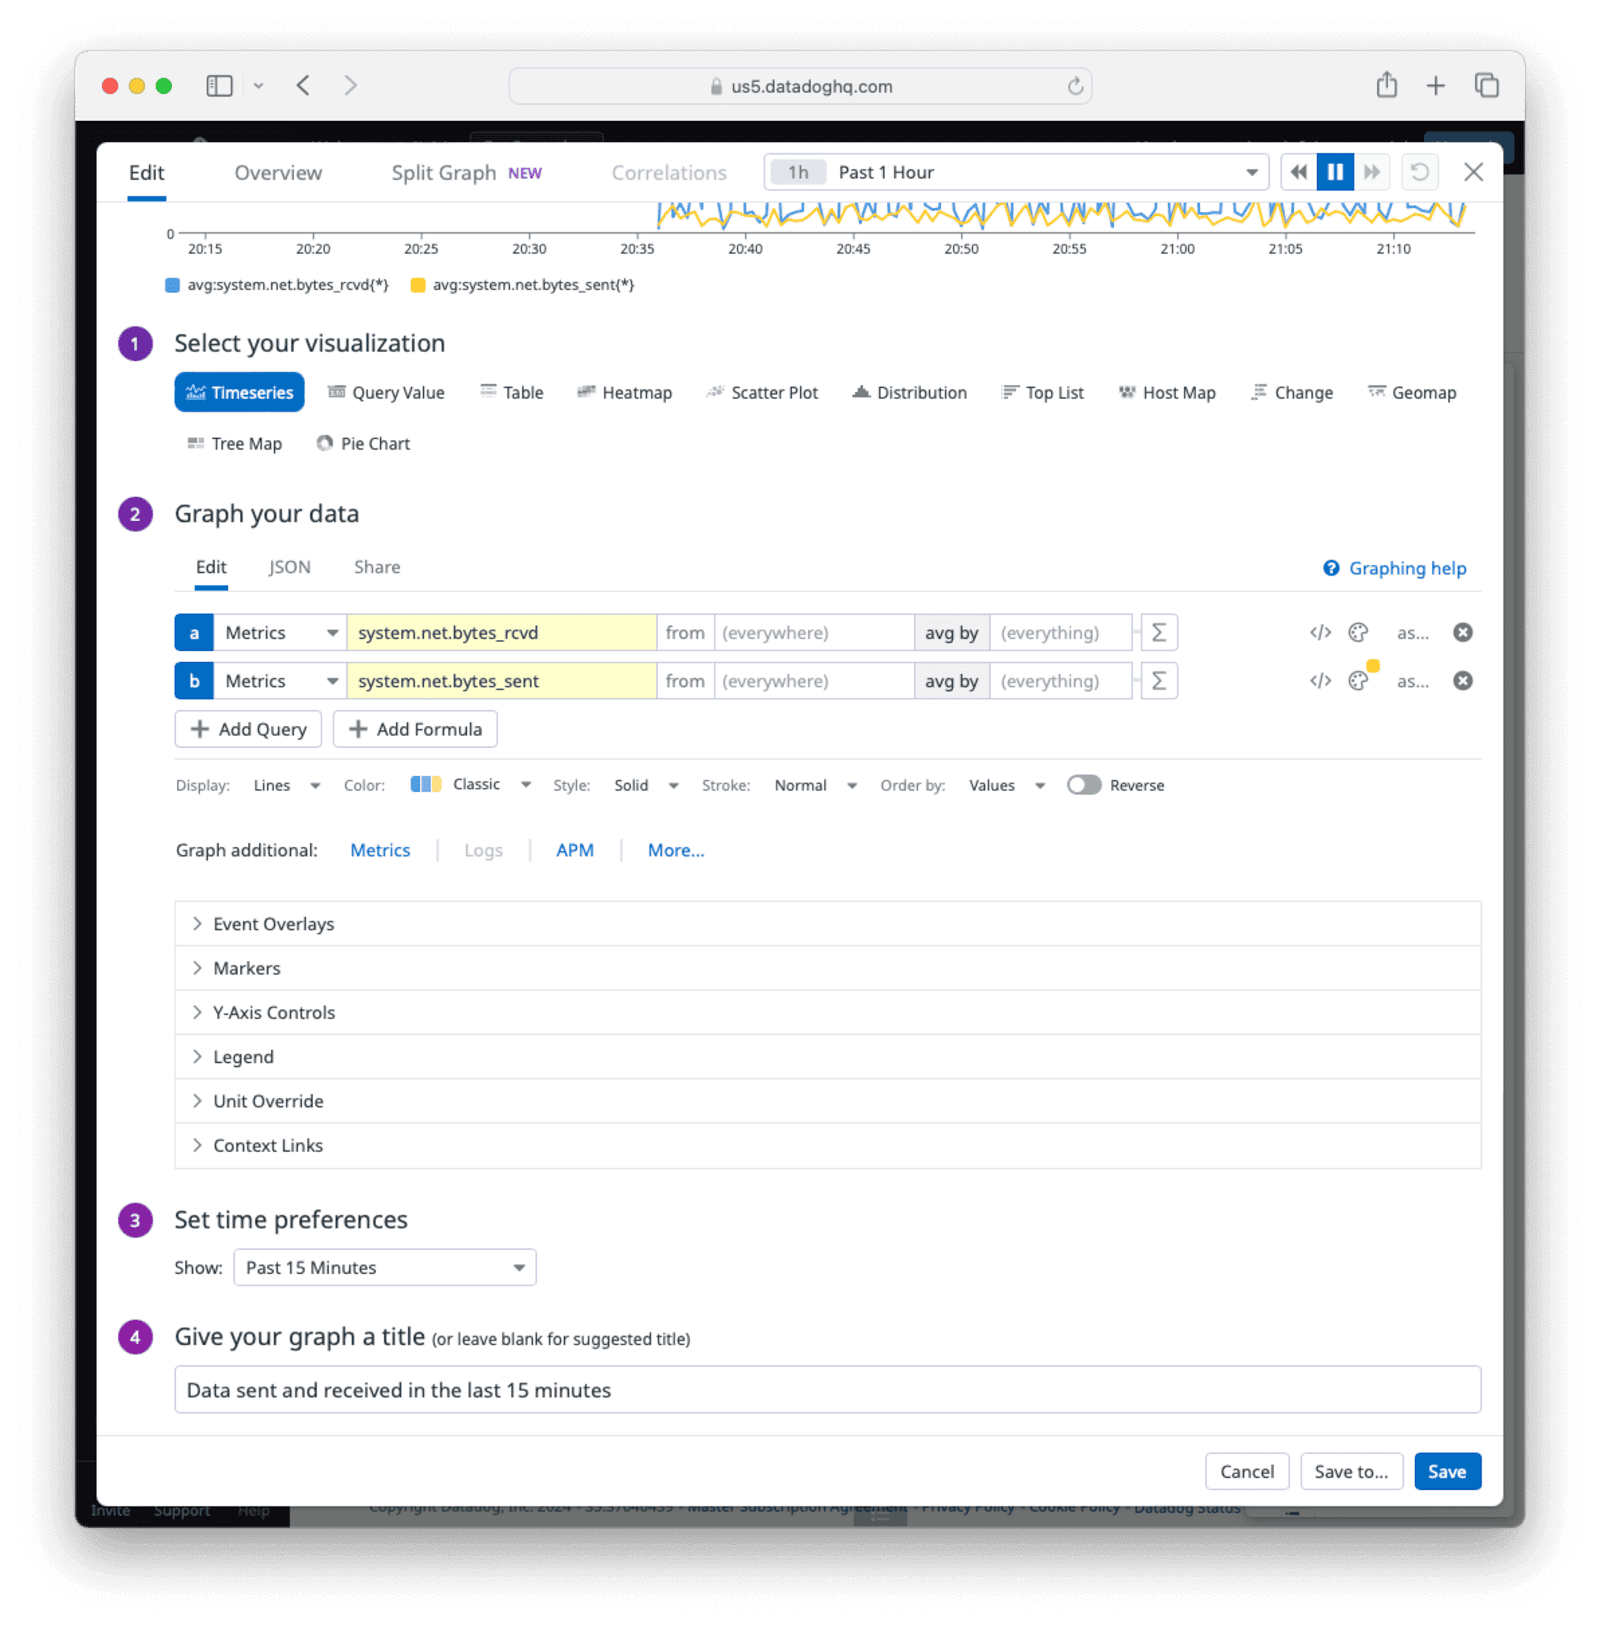
Now add a widget to your dashboard. Under Widgets in the right-hand sidebar, select the Timeseries widget. For the metrics to monitor, select system.net.bytes_rcvd and system.net.bytes_sent. You can give the metrics different colors to differentiate the graphs.
Under Set time preference choose Past 15 minutes and give your graph a title.
Click Save .
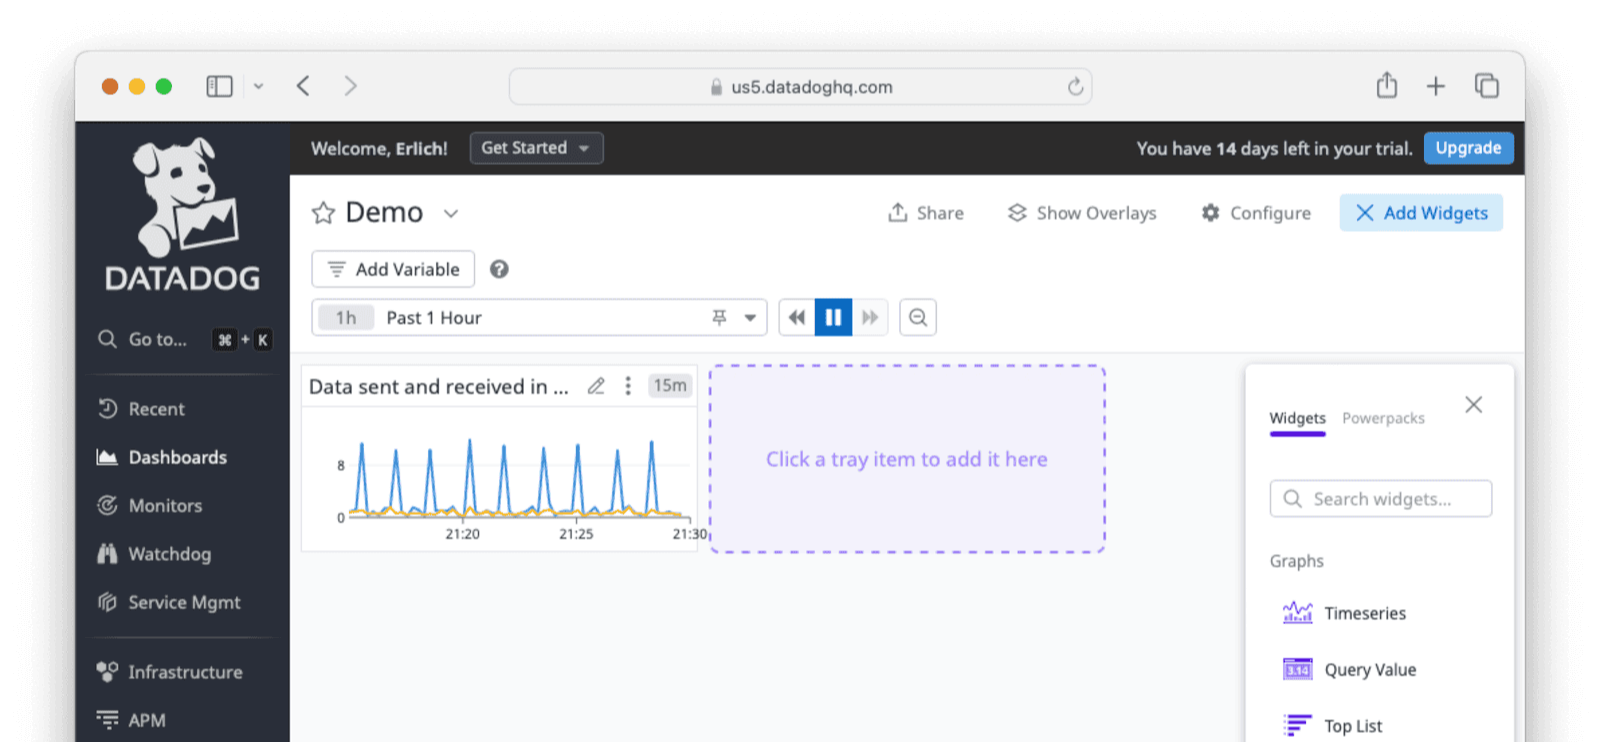
The new widget will now be available on the dashboard.
Use The Datadog Agent On A Remote Host#
You can install the Datadog Agent on a separate machine to monitor Prometheus metrics or OpenMetrics data from a FusionAuth host remotely. The FusionAuth Prometheus endpoint can also be monitored using the OpenMetric-Datadog integration.
To access the Prometheus endpoint and allow Prometheus metrics on your FusionAuth instance, ensure you have configured an API key by following the steps in the Set Up Prometheus API Access In FusionAuth section.
Integrating Datadog with OpenMetrics or Prometheus consists of two parts: First you install the integration using the install button on the tile in the Datadog UI, then you install the Datadog Agent and configure an OpenMetrics or Prometheus collector.
Integrate Datadog With OpenMetrics#
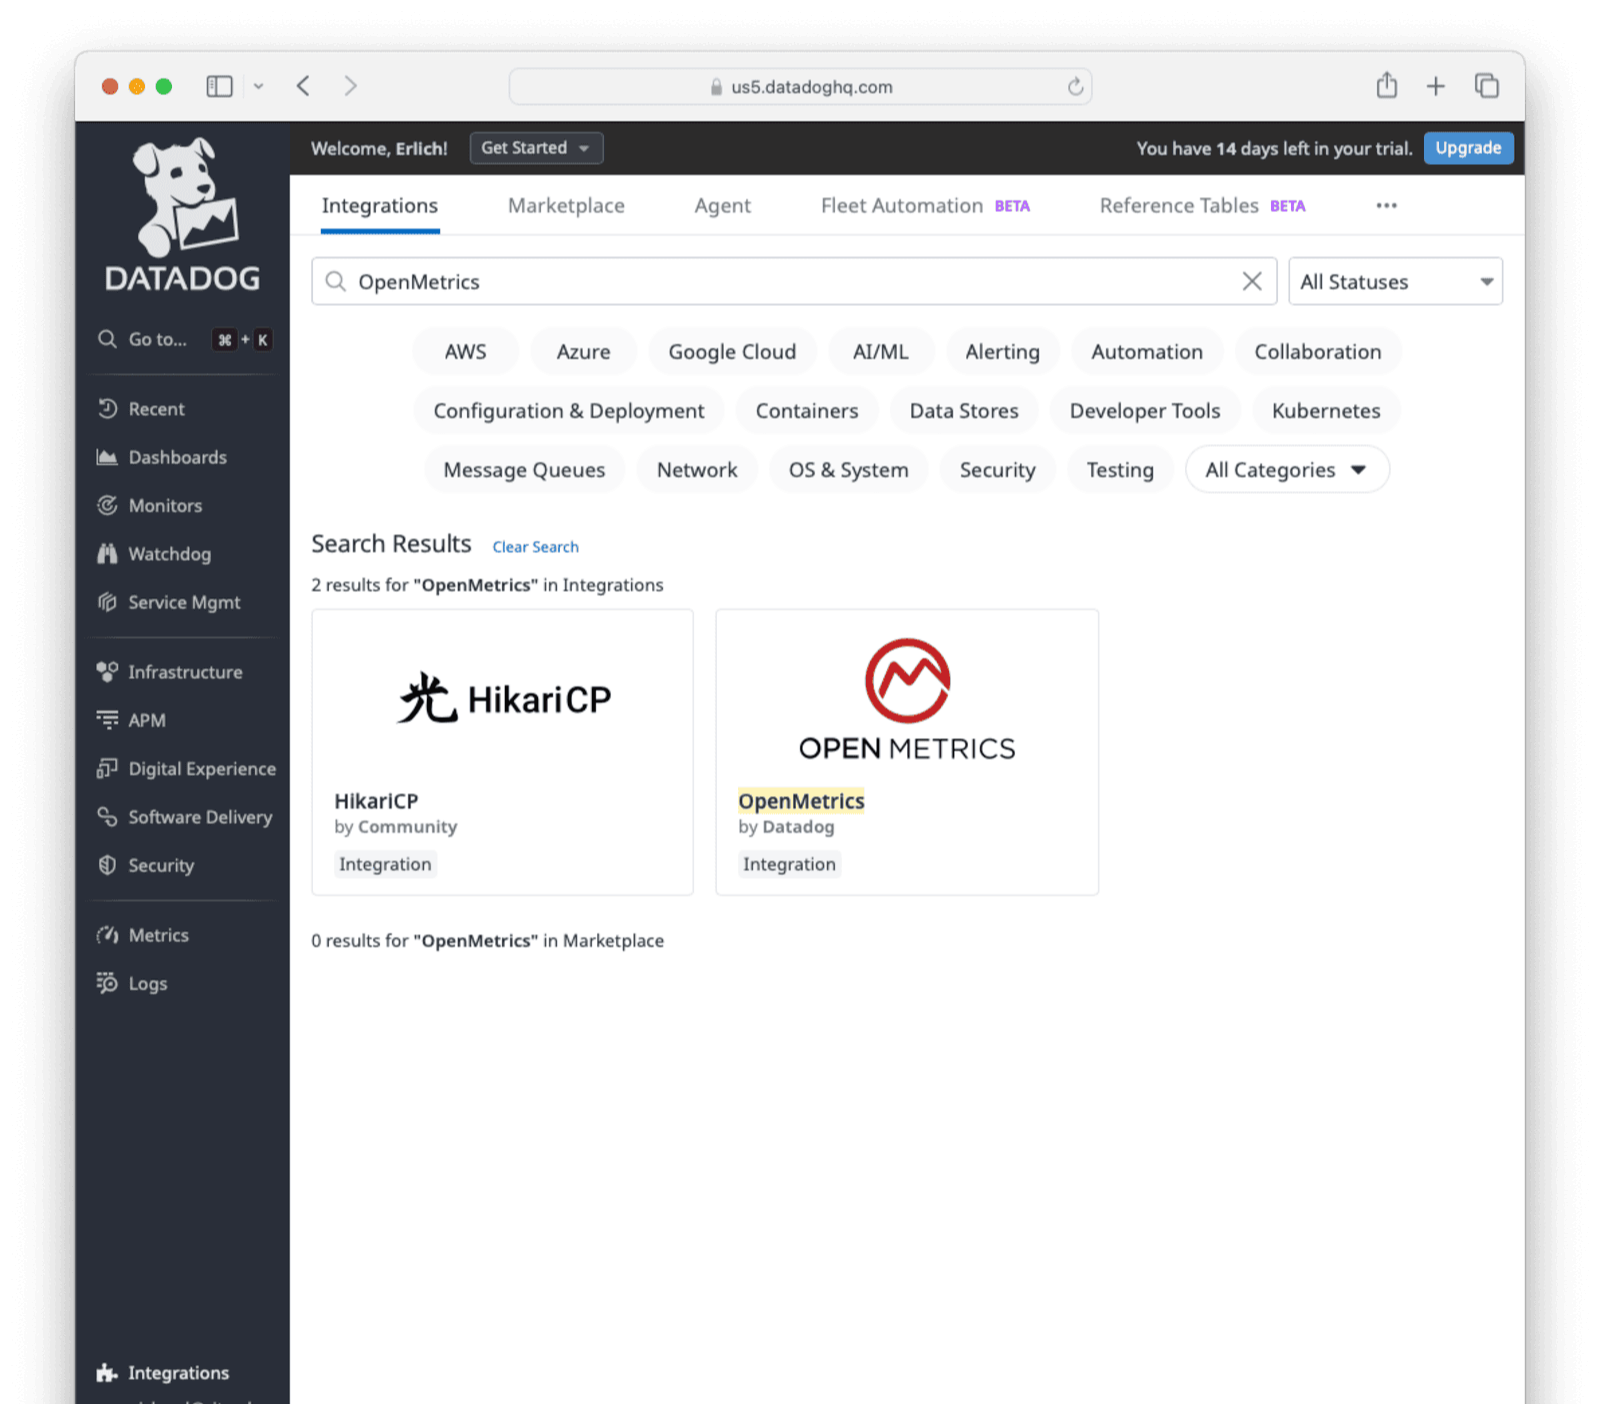
To install the OpenMetrics integration in Datadog, select Integrations and select the OpenMetrics tile.
Integrate Datadog With Prometheus#
To install the Prometheus integration in Datadog, select Integrations from the left sidebar, and select the Prometheus tile.
Install The Datadog Agent#
To install the Datadog Agent, navigate to the agent download page and select your platform.
Follow the instructions for your platform. Take care to use the correct region. This guide uses us5.datadoghq.com, but yours may be different depending on your selection when you created your Datadog account in the Set Up A Datadog Account section. If prompted, choose a folder to save the download to or it will be saved to your default downloads folder.
Run the downloaded installer and follow the prompts, accept the license agreement, and enter your Datadog API key and region.
When installation is complete, you are given the option to launch the Datadog Agent Manager. Launch the Datadog Agent Manager.
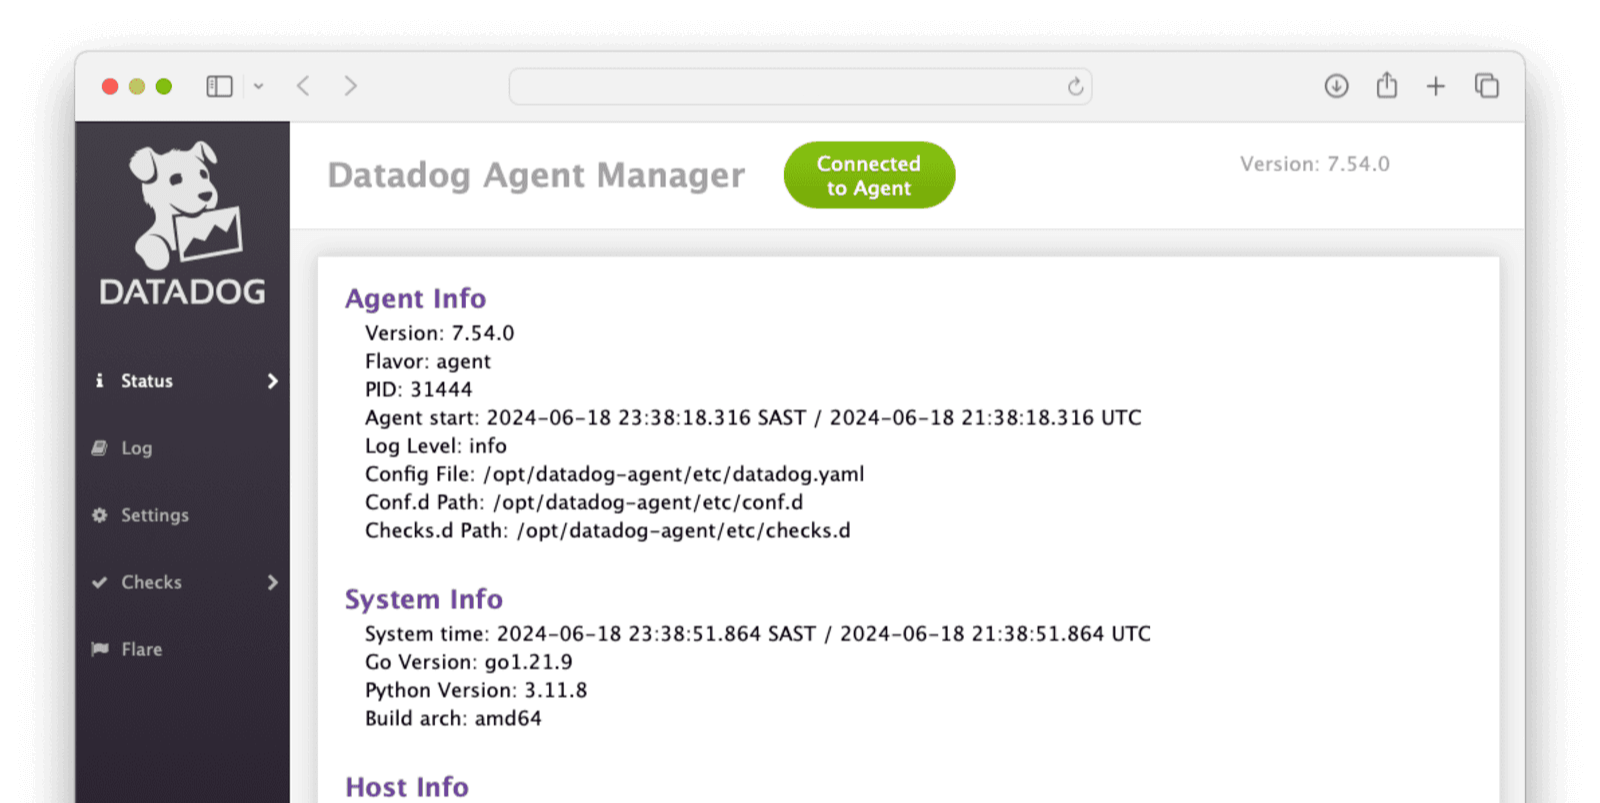
Look for a green button at the top that says Connected to Agent. If there is no button, follow the installation instructions again.
Configure Prometheus Metrics#
Click Checks in the left sidebar and select Manage Checks . Select Prometheus from the list.
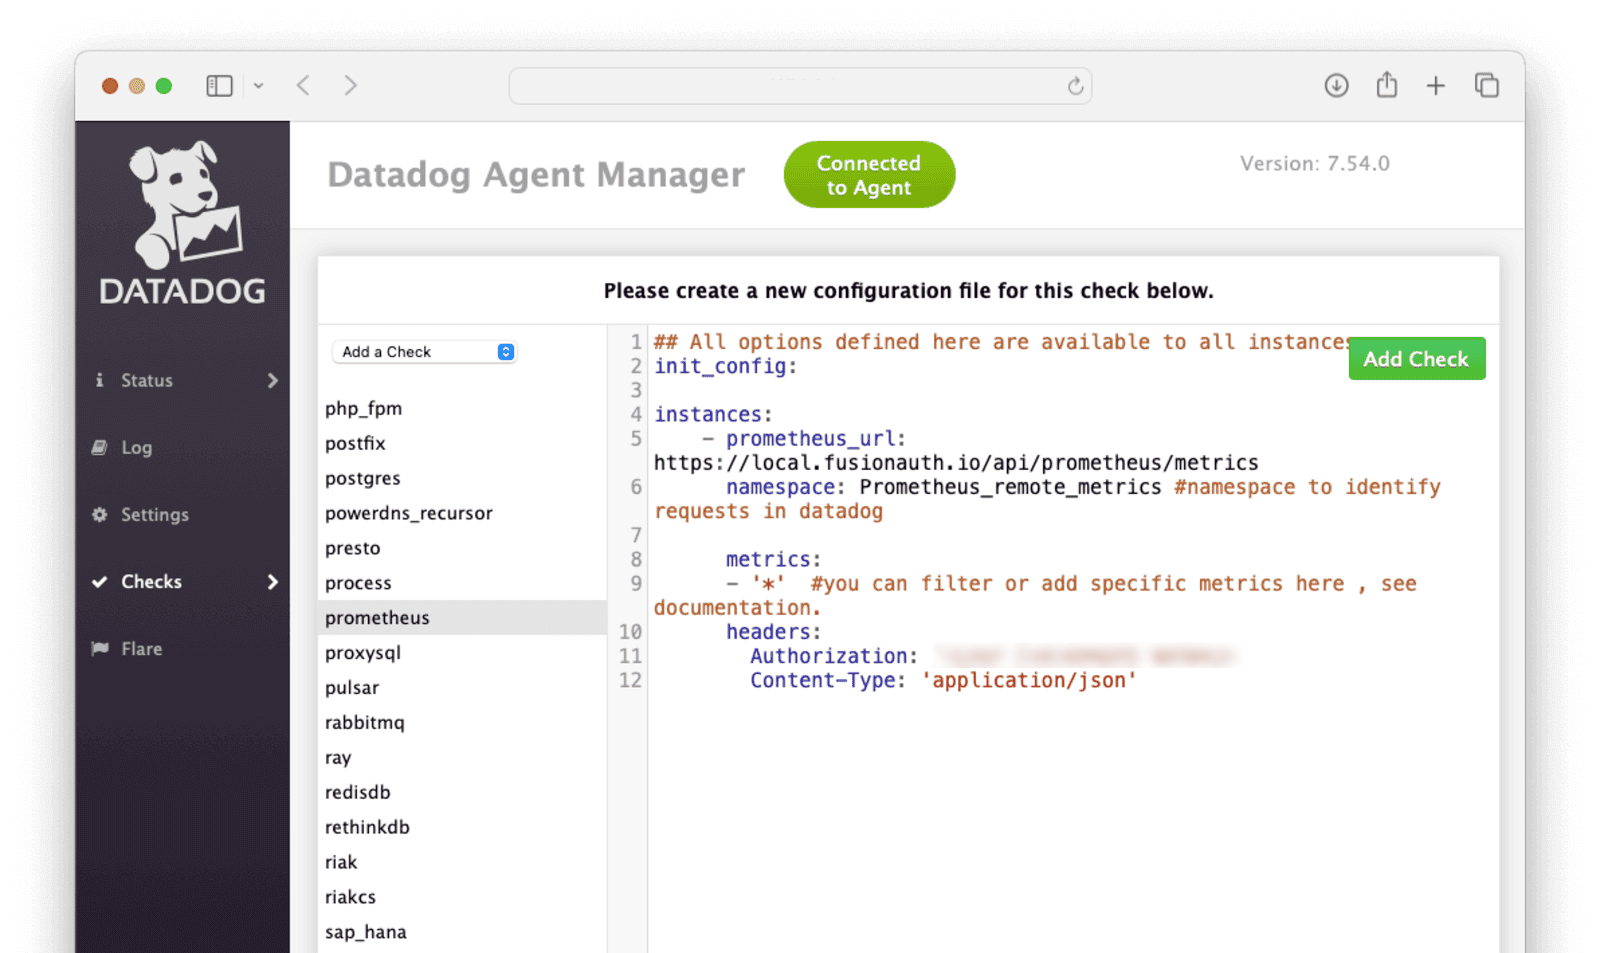
Add the following config details for the remote FusionAuth server to the right-hand pane:
## All options defined here are available to all instances.
init_config:

instances:
  - prometheus_url: https://<Your FusionAuth domain>/api/prometheus/metrics
    namespace: Prometheus_remote_metrics # namespace to identify requests in Datadog
    metrics:
      - '*'  # you can filter or add specific metrics here, see documentation.
    headers:
      Authorization: '<Your FusionAuth API key>'
      Content-Type: 'application/json'
Save the config by clicking Add check .
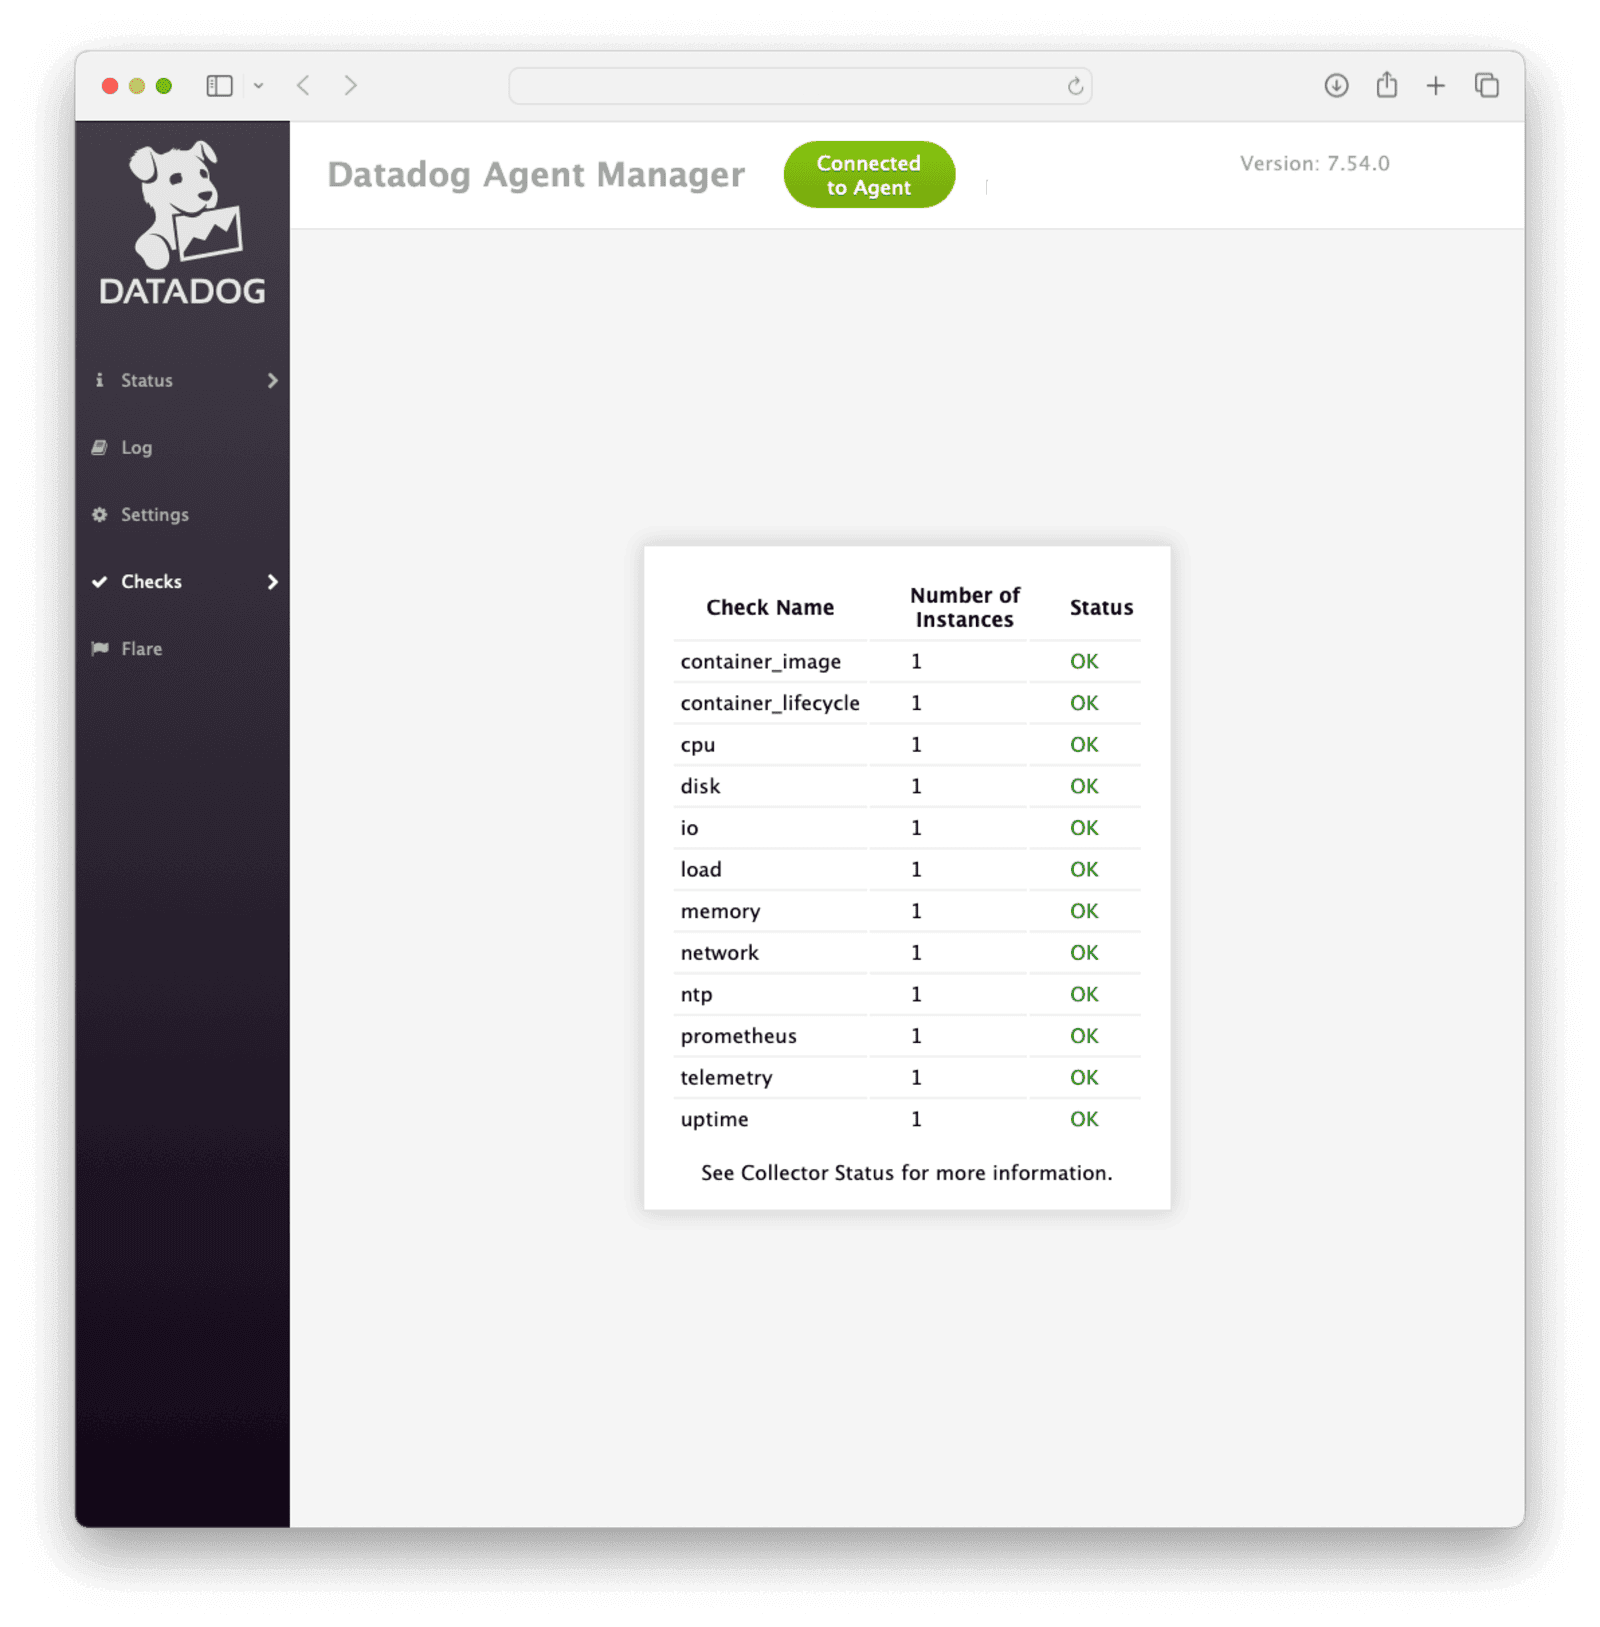
Restart the agent. Select Checks from the sidebar to visit the checks summary page and confirm that the collector is running.
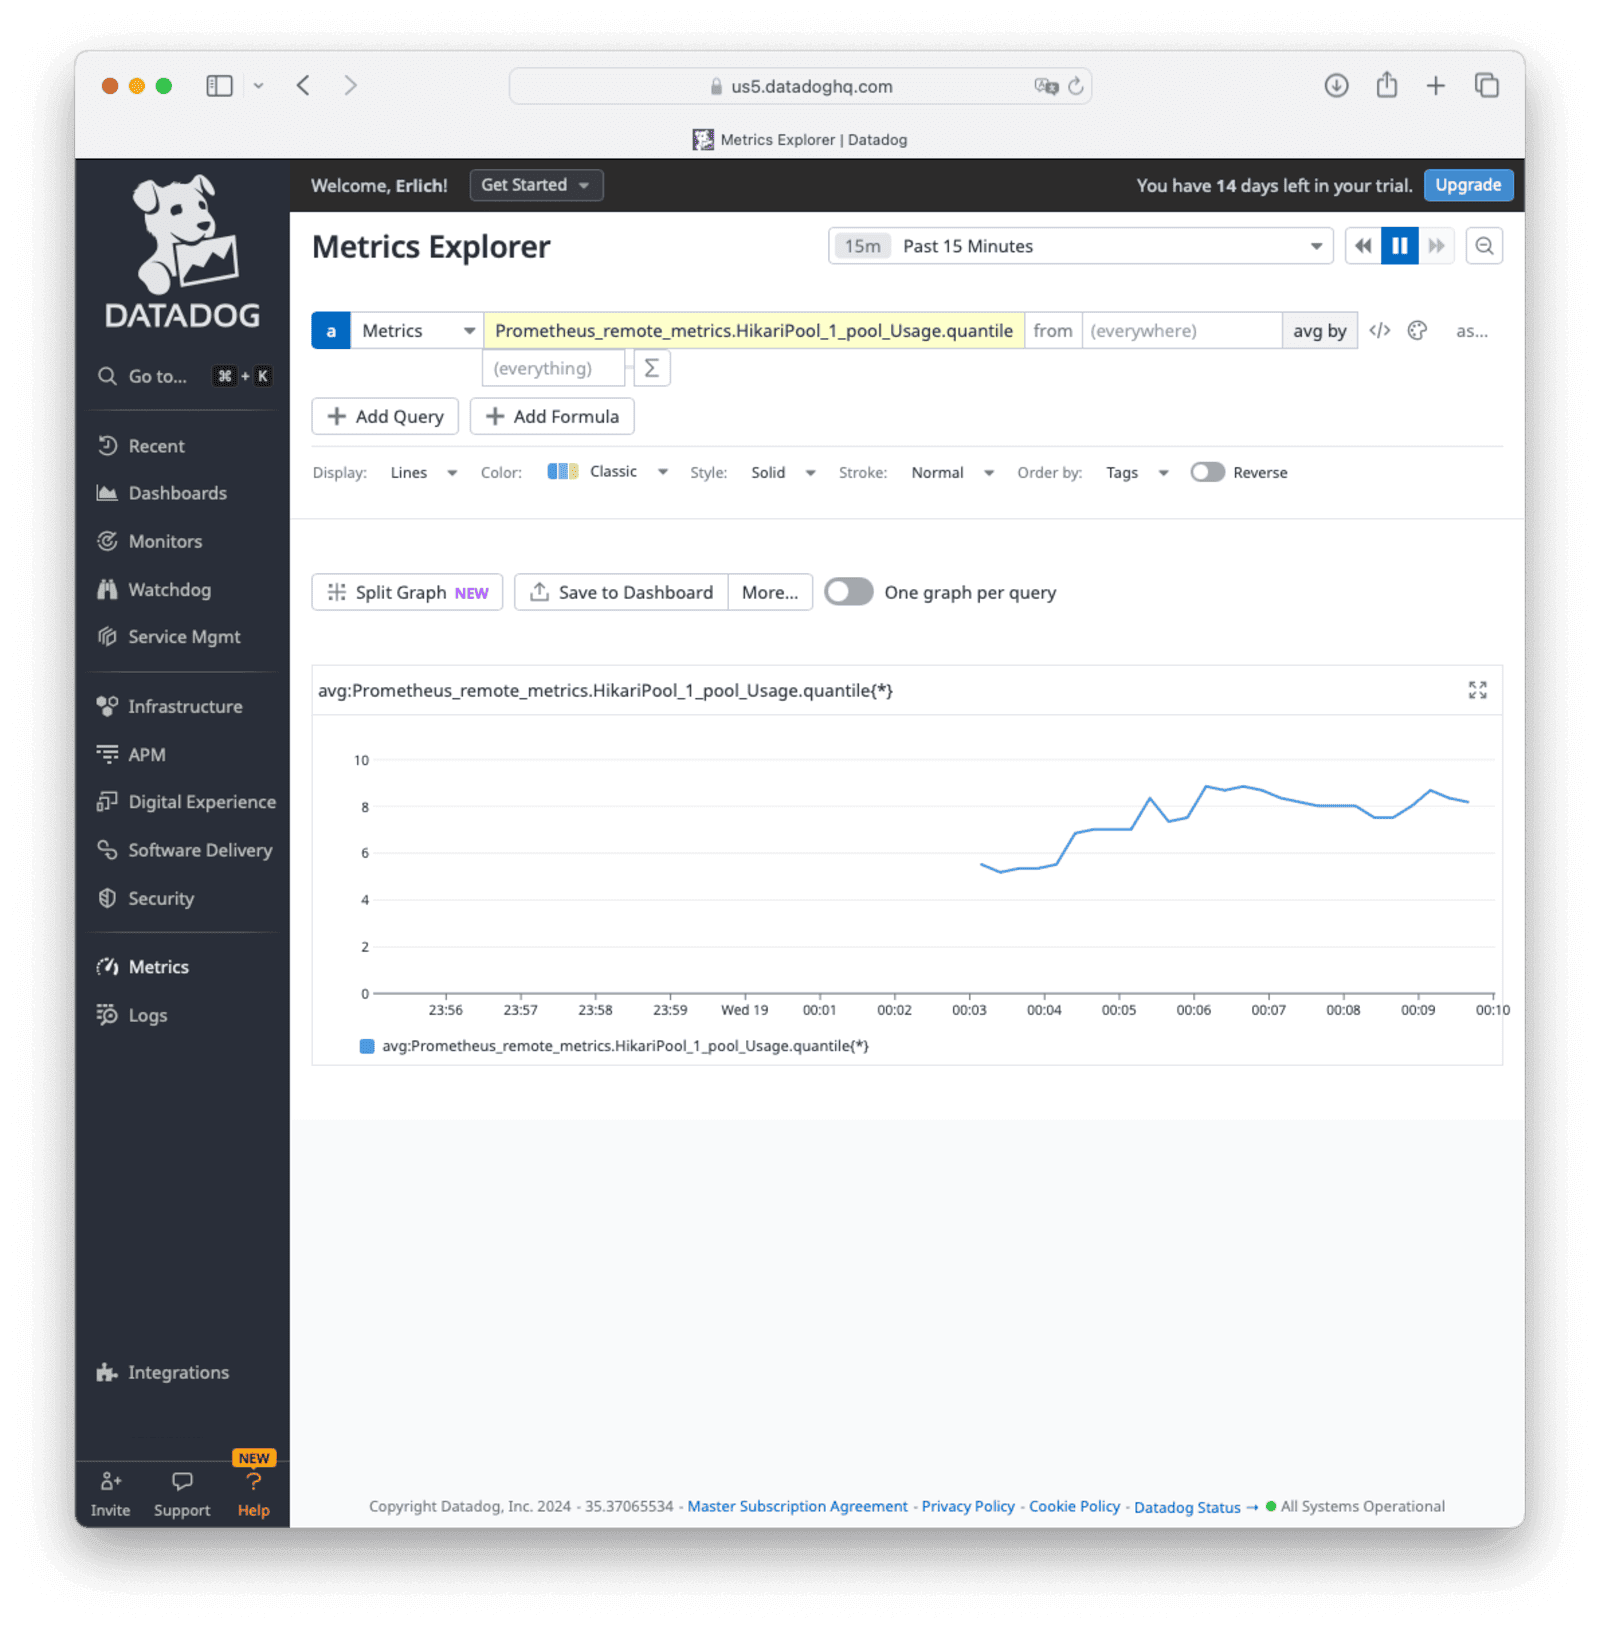
To see the results in Datadog, navigate to Metrics Explorer . Use the Prometheus_remote_metrics namespace defined in the above config to add metrics in the metrics explorer, and specify the last 15 minutes for the period. You will see data being pulled from the FusionAuth Prometheus endpoint. Now you can follow the instructions in Set Up A Datadog Dashboard to add these metrics to your dashboard.
Use A Python App To Send Events To Datadog#
You can use the Datadog API to create cron jobs or services on your FusionAuth instance to provide additional custom events or logs to Datadog.
Before running a script, install the requests and datadog-api-client libraries.
pip install requests datadog-api-clientThe sample Python script below checks that a given FusionAuth host is alive and sends a status event to Datadog.
import requests
from datadog_api_client import ApiClient, Configuration
from datadog_api_client.v1.api.events_api import EventsApi
from datadog_api_client.v1.model.event_create_request import EventCreateRequest
from datetime import datetime
# Get the current date and time
now = datetime.now()
def is_website_alive(url):
try:
response = requests.get(url, timeout=10)
# Check if the response status code is 200 (OK)
if response.status_code == 200:
return True
else:
return False
except requests.RequestException as e:
# If there was an issue (e.g., network error, timeout), the website is not reachable
print(f"Error: {e}")
return False
formatted_now = now.strftime("%Y-%m-%d %H:%M:%S")
url = "https://<Your FusionAuth domain>"
if is_website_alive(url):
status = f"[{ formatted_now}] - {url} is alive. "
else:
status = f"[{ formatted_now}] - {url} is not reachable."
#### here you can define your message/event
body = EventCreateRequest(
title="FusionAuthStatusEvent",
text=status,
tags=[
"FusionAuth:StatusEvent",
],
)
configuration = Configuration()
configuration.api_key["apiKeyAuth"] = "<Your Datadog API key>"
configuration.server_variables["site"] = "us5.datadoghq.com" #your Region
configuration.api_key["appKeyAuth"] = "<your Application key if needed>"
with ApiClient(configuration) as api_client:
api_instance = EventsApi(api_client)
response = api_instance.create_event(body=body)
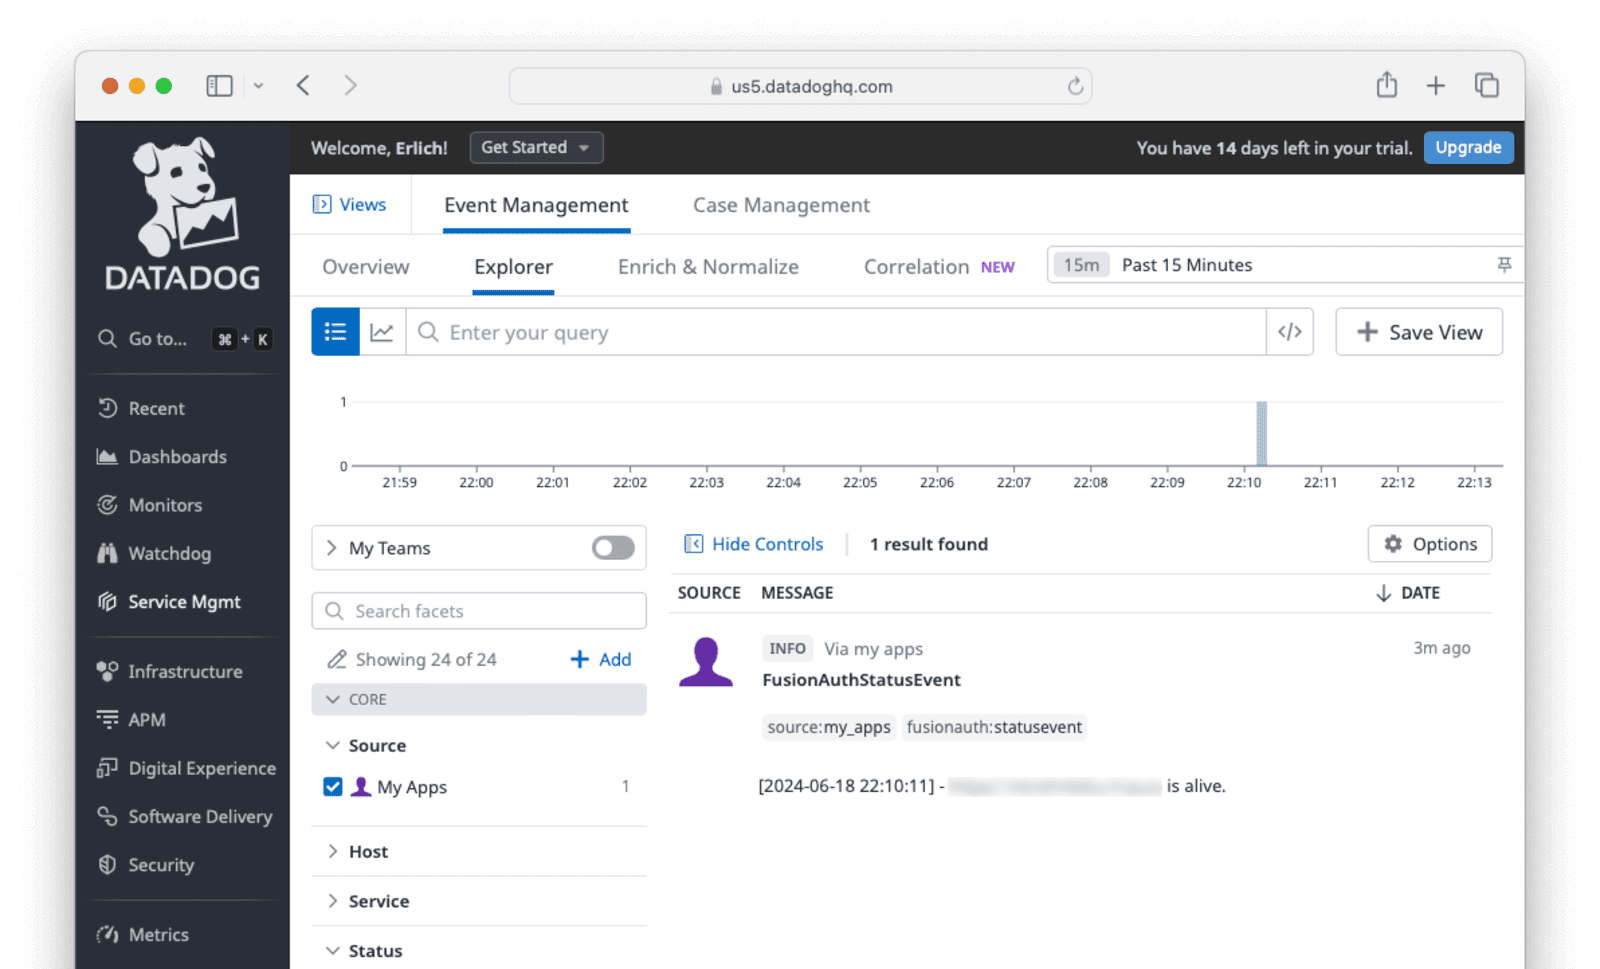
print(response)Run the script, then navigate to Service Mgmt -> Event Management -> Explorer on the Datadog website to see that the event was logged.
Read more about the available Datadog APIs here.
Send Data To Datadog With The OpenTelemetry Collector#
You can use the OpenTelemetry Java collector to push data from the FusionAuth host to Datadog.
To use the OpenTelemetry Java collector with Docker, modify the official FusionAuth Docker image to download the OpenTelemetry Java agent and change the script that starts FusionAuth. Configuration values for Java OpenTelemetry are described here.
Save the Dockerfile from the FusionAuth containers repo to your computer.
Edit the file. Above the comment labeled "###### Start FusionAuth App", insert the following code.
##### NEW FOR OPENTELEMETRY #######################################################################
RUN mkdir -p /var/lib/apt/lists/partial \
    && chmod 755 /var/lib/apt/lists/partial \
    && apt update \
    && apt install -y ca-certificates \
    && cd /usr/local/fusionauth \
    && curl -L -o otel.jar https://github.com/open-telemetry/opentelemetry-java-instrumentation/releases/download/v2.4.0/opentelemetry-javaagent.jar\
    && (head -n -1 /usr/local/fusionauth/fusionauth-app/bin/start.sh; echo 'exec "${JAVA_HOME}/bin/java" -javaagent:/usr/local/fusionauth/otel.jar -Dotel.resource.attributes=service.name=fusionauth -Dotel.traces.exporter=otlp -Dotel.exporter.otlp.endpoint=http://otel:4318 -cp "${CLASSPATH}" ${JAVA_OPTS} io.fusionauth.app.FusionAuthMain <&- >> "${LOG_DIR}/fusionauth-app.log" 2>&1') > temp.sh \
    && mv temp.sh /usr/local/fusionauth/fusionauth-app/bin/start.sh;
RUN chown fusionauth:fusionauth /usr/local/fusionauth/otel.jar /usr/local/fusionauth/fusionauth-app/bin/start.sh \
    && chmod +x /usr/local/fusionauth/fusionauth-app/bin/start.sh
This code edits the start.sh file, the script that starts FusionAuth when the container starts, replacing the final line with the new command.
By default, the OpenTelemetry Java agent sends data to the OpenTelemetry collector at http://localhost:4317. The code above changes it to send data to the container at http://otel:4318.
Build the Dockerfile into a new image to use in place of the official FusionAuth one.
docker build --platform linux/amd64 -t faimage .Now save the docker-compose.yaml and sample .env files from the FusionAuth containers repo.
In the docker-compose.yaml file, change the line image: fusionauth/fusionauth-app:latest to point to the image you have just built image: faimage:latest.
To include the OpenTelemetery collector service in your compose configuration, add the following service to the docker-compose.yaml file.
# OpenTelemetry Collector Contrib
  otel:
    image: otel/opentelemetry-collector-contrib:latest
    volumes:
      - ./otel-collector.yml:/etc/otel-collector.yml
    command: ["--config=/etc/otel-collector.yml"]
    #,"--feature-gates=-exporter.datadogexporter.DisableAPMStats"]
    ports:
      - "1888:1888"   # pprof extension
      - "8888:8888"   # Prometheus metrics exposed by the collector
      - "8889:8889"   # Prometheus exporter metrics
      - "13133:13133" # health_check extension
      - "4317:4317"   # OTLP gRPC receiver
      - "4318:4318"   # OTLP gRPC receiver
      - "55679:55679" # zpages extension
    environment:
      - OTEL_EXPORTER_OTLP_LOGS_ENDPOINT=http://otel:4318/v1/logs
      - OTEL_EXPORTER_OTLP_METRICS_ENDPOINT=http://otel:4318
      - OTEL_EXPORTER_OTLP_TRACES_ENDPOINT=http://otel:4318/v1/traces
    networks:
      - db_net

    depends_on:
      - db
      - search
      - fusionauth
Now create an otel-collector.yml file in the same directory as the docker-compose.yaml file to use with the otel container. This file is passed into the container with the docker-compose.yaml configuration. Add the following to the otel-collector.yml file.
receivers:
  hostmetrics:
      scrapers:
        load:
        cpu:
        disk:
        filesystem:
        memory:
        network:
        paging:
        # process:
  otlp:
    protocols:
      http:
        #endpoint: "localhost:4318"
      grpc:
        #endpoint: "localhost:4317"
processors:
  batch:
    send_batch_max_size: 100
    send_batch_size: 10
    timeout: 10s

connectors:
  datadog/connector:

exporters:
  datadog/exporter:
    api:
      site: "us5.datadoghq.com"   #<make sure of your region>
      key: "<Your Datadog API key>"
service:
  pipelines:
    traces:
      receivers: [otlp]
      processors: [batch]
      exporters: [datadog/connector, datadog/exporter]
    metrics:
      receivers: [hostmetrics, otlp, datadog/connector] #// The connector provides the metrics to your metrics pipeline
      processors: [batch]
      exporters: [datadog/exporter]
Start the Docker containers with the command below.
docker compose -f docker-compose.yaml up -d
# if you want to monitor the progress
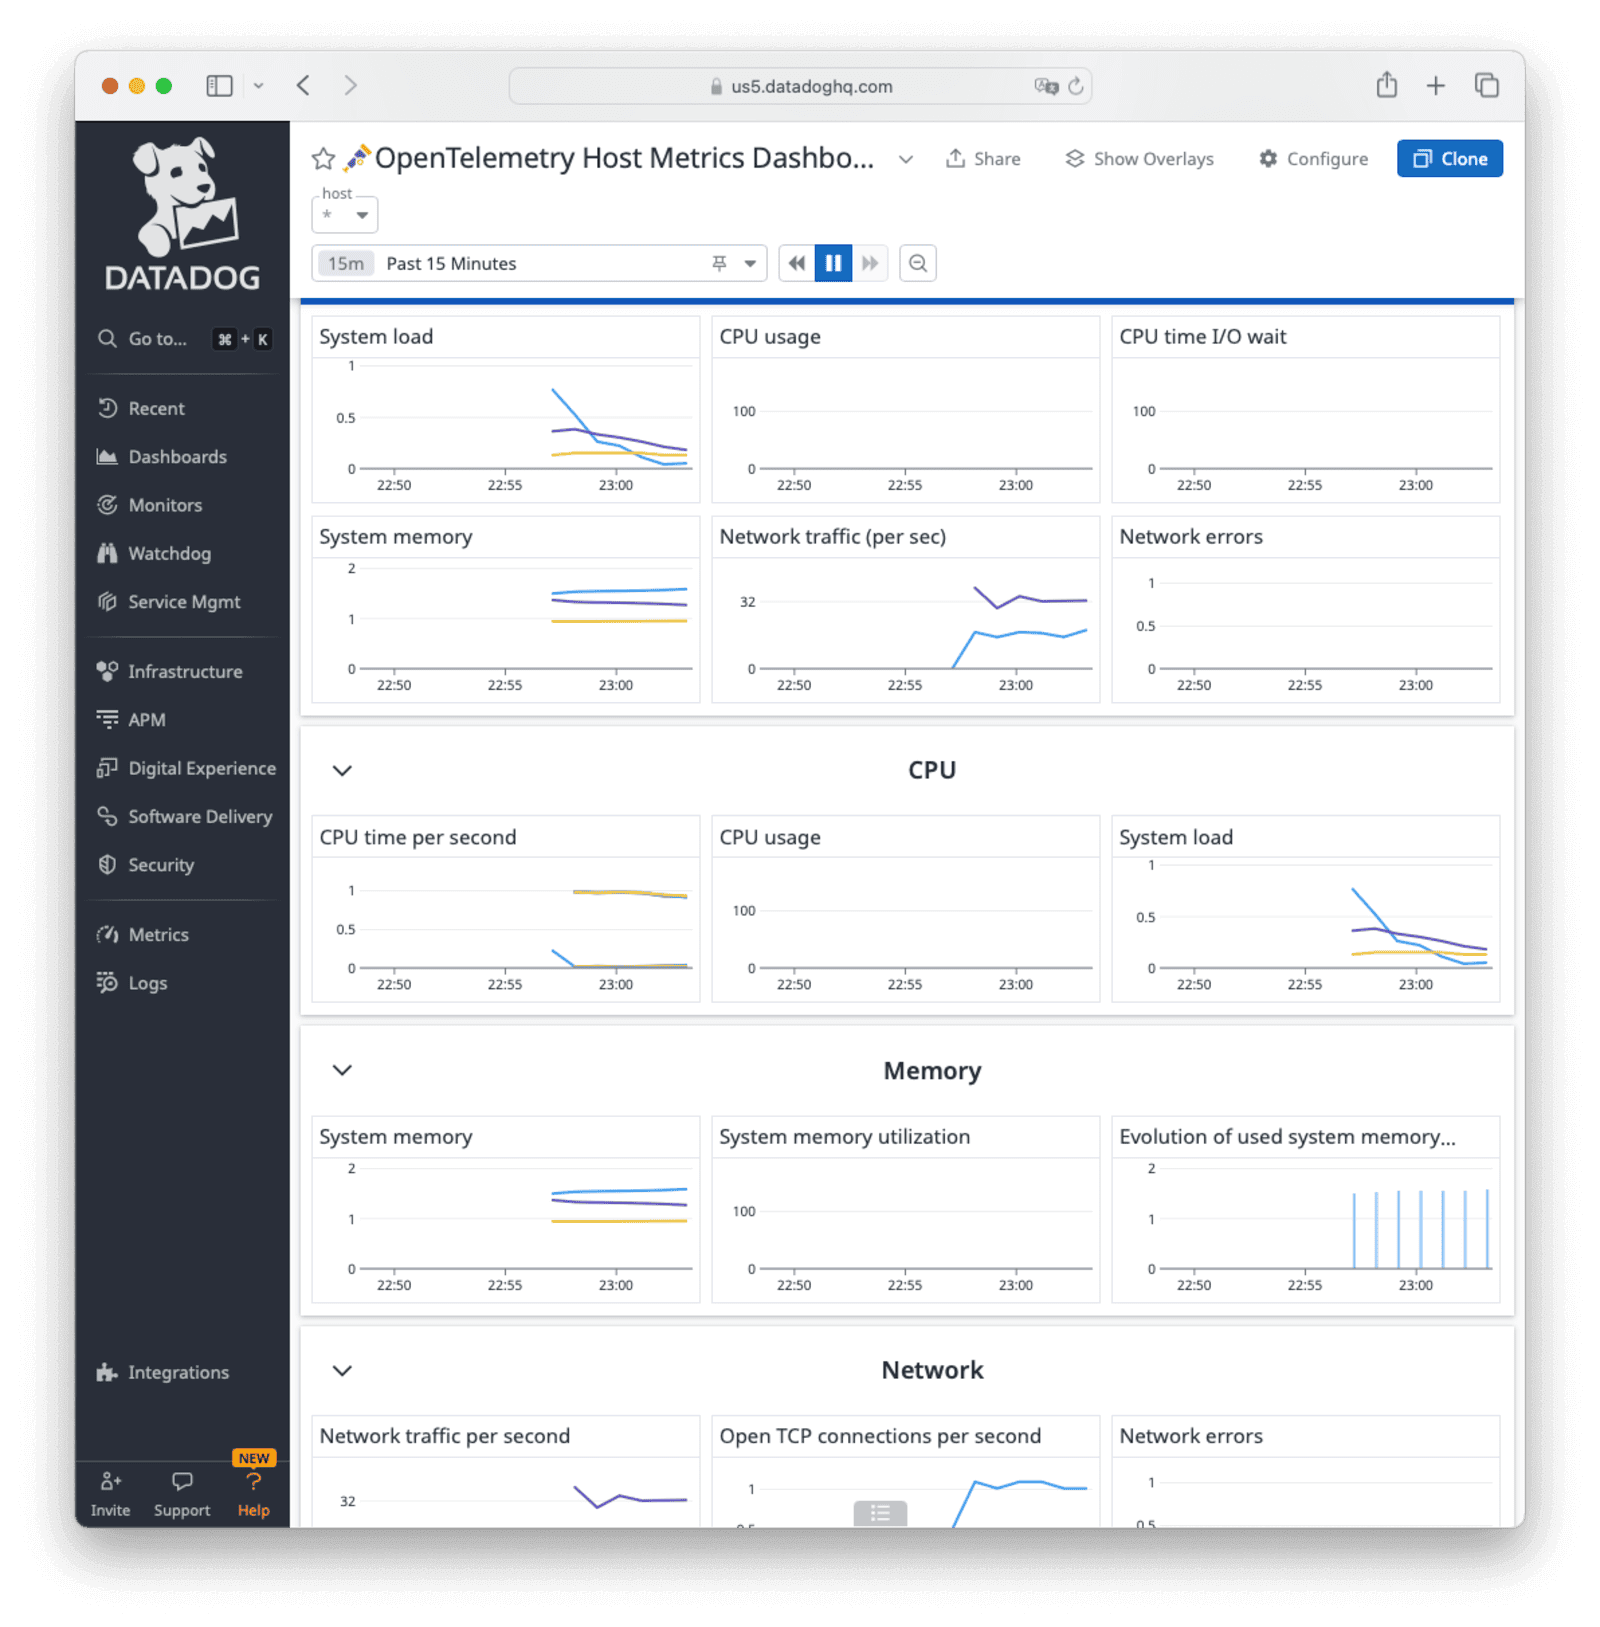
# docker compose logs --followVisualize OpenTelemetry Metrics In Datadog#
Select Integrations from the left sidebar, search for "OpenTelemetry", and click on the OpenTelemetry tile to install the integration.
On the Datadog website, see the OpenTelemetry metrics on graphs by navigating to Dashboards -> Dashboard List -> OpenTelemetry Host Metrics Dashboard .
Further Reading#
- FusionAuth metrics
- OpenTelemetry documentation
- OpenTelemetry Java documentation
- Datadog OpenTelemetry documentation
- FusionAuth containers
- Getting Started with the Datadog Agent
- Datadog Ubuntu Agent Install Script Configurations options
- Install FusionAuth with Docker
- Pricing
- Datadog Agents
- OpenTelemetry Metric Format
- Datadog Metric Types
- Datadog Metrics