Monitor With Splunk
Overview#
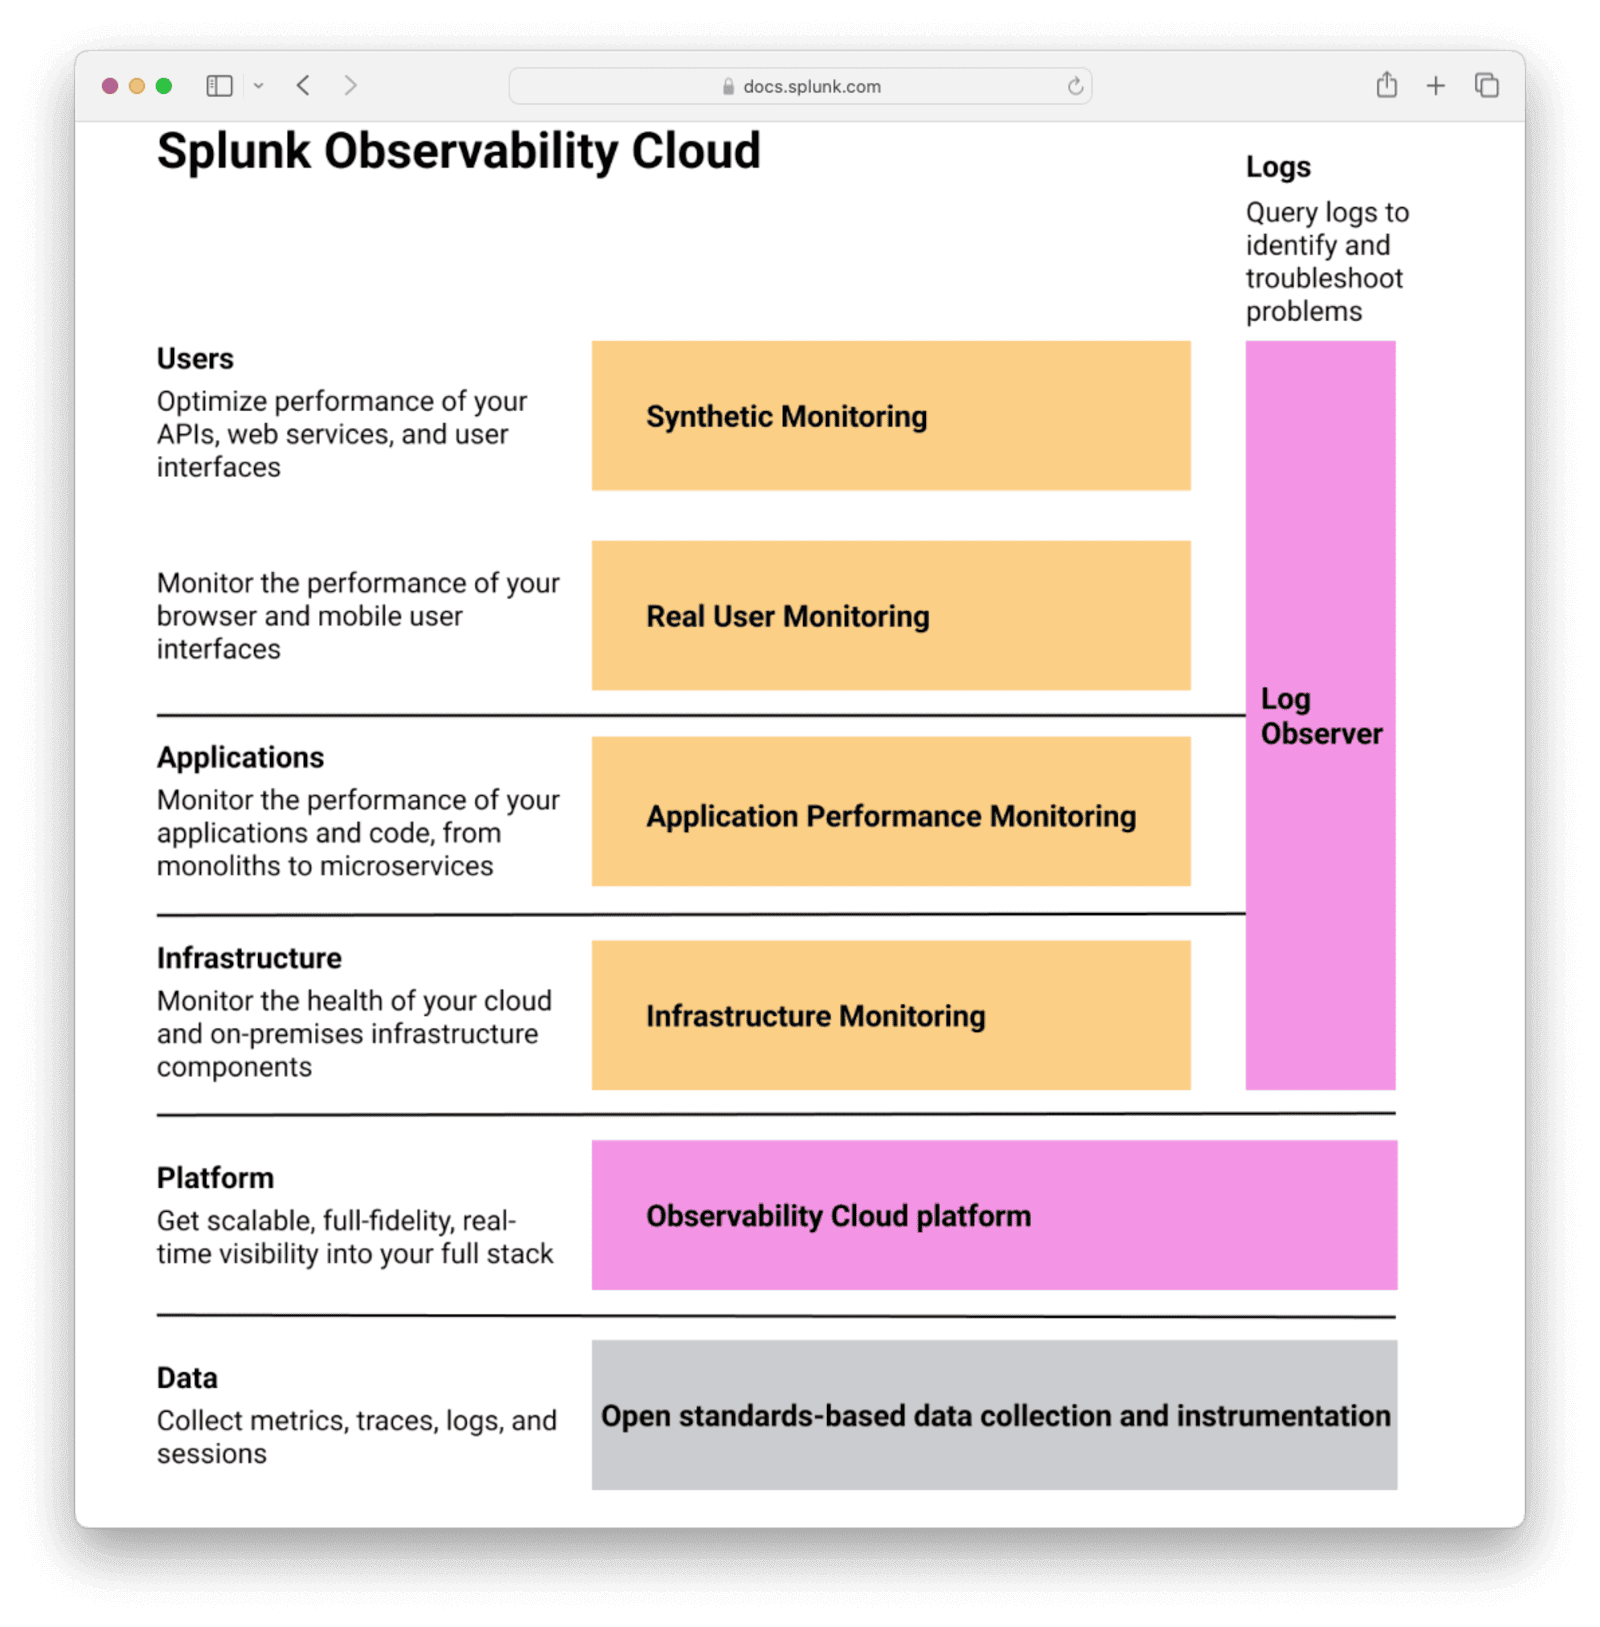
Splunk Observability Cloud is a Software as a Service (SaaS) solution for infrastructure monitoring (Splunk IM), application performance monitoring (Splunk APM), real user monitoring (Splunk RUM), and synthetic monitoring (Splunk Synthetic Monitoring). Splunk Observability Cloud also provides a direct integration with logs ingested in Splunk Cloud Platform and Splunk Enterprise through Log Observer Connect.
This guide explains how to connect FusionAuth to Splunk through Docker with the OpenTelemetry Collector using the Splunk API, as well as which FusionAuth metrics are useful in Splunk and how to create a simple dashboard to show them.
Before continuing with this guide, please go through the FusionAuth guide to monitoring to get an overview of the available metrics and choose the ones relevant to your needs.
Create A Splunk Account#
First, register for a Splunk account:
- Register for the Observability Cloud trial at https://www.splunk.com/en_us/download/o11y-cloud-free-trial.html. Don't sign up on the Splunk homepage - https://www.splunk.com/en_us/download/splunk-cloud.html. This is not the correct service for this guide. Splunk divides its products into completely separate dashboards.
- Verify your email address with the link in the email Splunk sends you. This should also log you in to the Observability dashboard.
- In the future, you can log in to the dashboard at https://login.signalfx.com.
To learn more about the Splunk Observability platform, refer to the documentation here. Pricing of the platform is available here. Infrastructure Monitoring, Log Observer Connect, and Synthetic Monitoring are included in the Splunk Infrastructure monthly fee. Each Splunk product has a separate 14-day trial.
The diagram from Splunk below shows what the Observability Cloud can monitor.
Test Your Splunk Access Token#
You'll need a Splunk organization access token to test uploading custom data with the Splunk API. Importing metrics with the API is documented here.
- Log in to your Observability account at https://login.signalfx.com.
- Click the logo at the top left to expand the menu labels.
- Click Settings -> View Profile -> Organizations .
- Note your realm and endpoints, for instance,
us1,https://api.us1.signalfx.com, andhttps://ingest.us1.signalfx.com.
- Note your realm and endpoints, for instance,
- To get an access token (also called organization token):
- Click Settings -> Access Tokens .
- Expand the
Defaultaccess token. - Click Show Token and save the token value to use later.
If you mistakenly expose your default token secret, there is no way to change the value. Instead, you need to disable the token from the menu on the Tokens page on the right. Then you need to create a new token of type Ingest to work with the API.
Test that you can import data with the terminal command below. Replace yourtoken with your token in the X-SF-TOKEN header and us1 with your realm in the last line.
curl --request POST \
  --header "Content-Type: application/json" \
  --header "X-SF-TOKEN: yourtoken" \
  --data \
  '{
      "gauge": [
          {
              "metric": "memory.free",
              "dimensions": { "host": "server1" },
              "value": 42
          }
      ]
  }' \
  https://ingest.us1.signalfx.com/v2/datapoint
The response should be "OK".
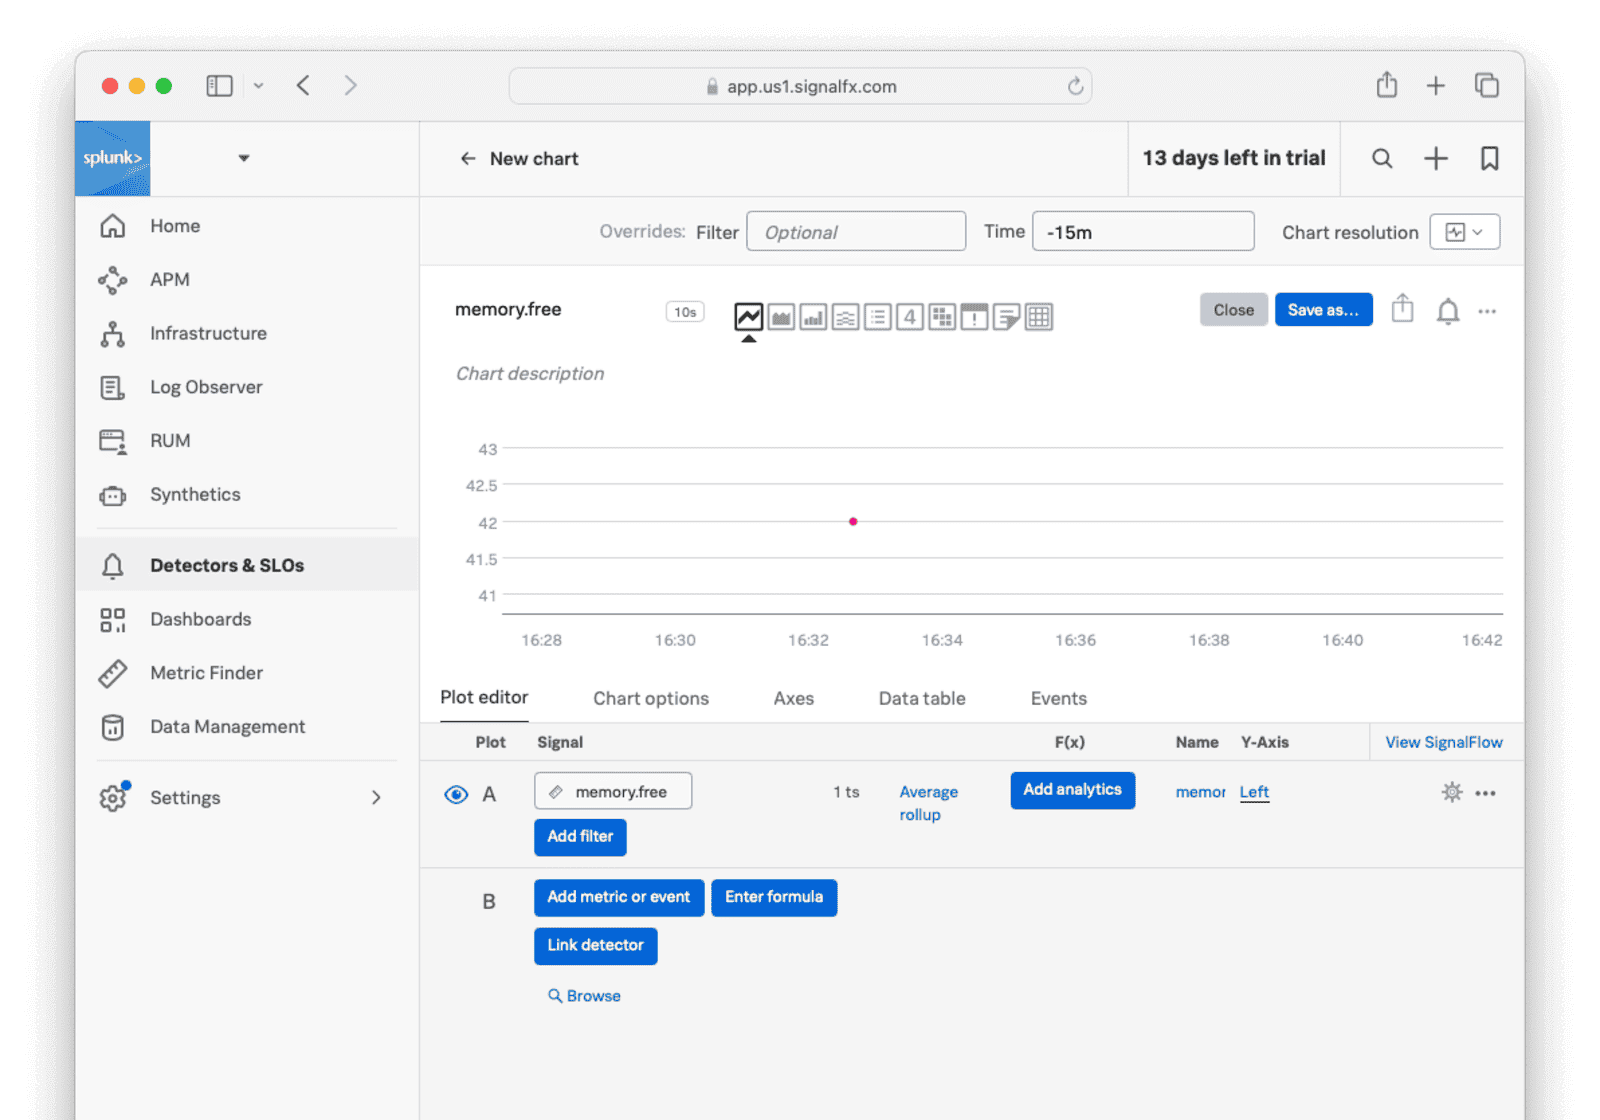
Return to the Observability dashboard home page and browse to Metric Finder . Enter memory in the text box and click Search metrics. Click memory.free. You should see the data point created by the above command on the chart. If you don't, try switching to the Column chart view or running the command again with a different value.
In a later section, you'll learn how to use this API to import real data from your FusionAuth instance.
Import Data To Splunk With The OpenTelemetry Linux Collector#
Instead of sending metrics manually to Splunk, you can send them automatically with OpenTelemetry. OpenTelemetry is both a protocol and software that is dedicated to monitoring, measuring, processing, collecting, and sending metrics. In this section, you will add OpenTelemetry to your normal FusionAuth instance.
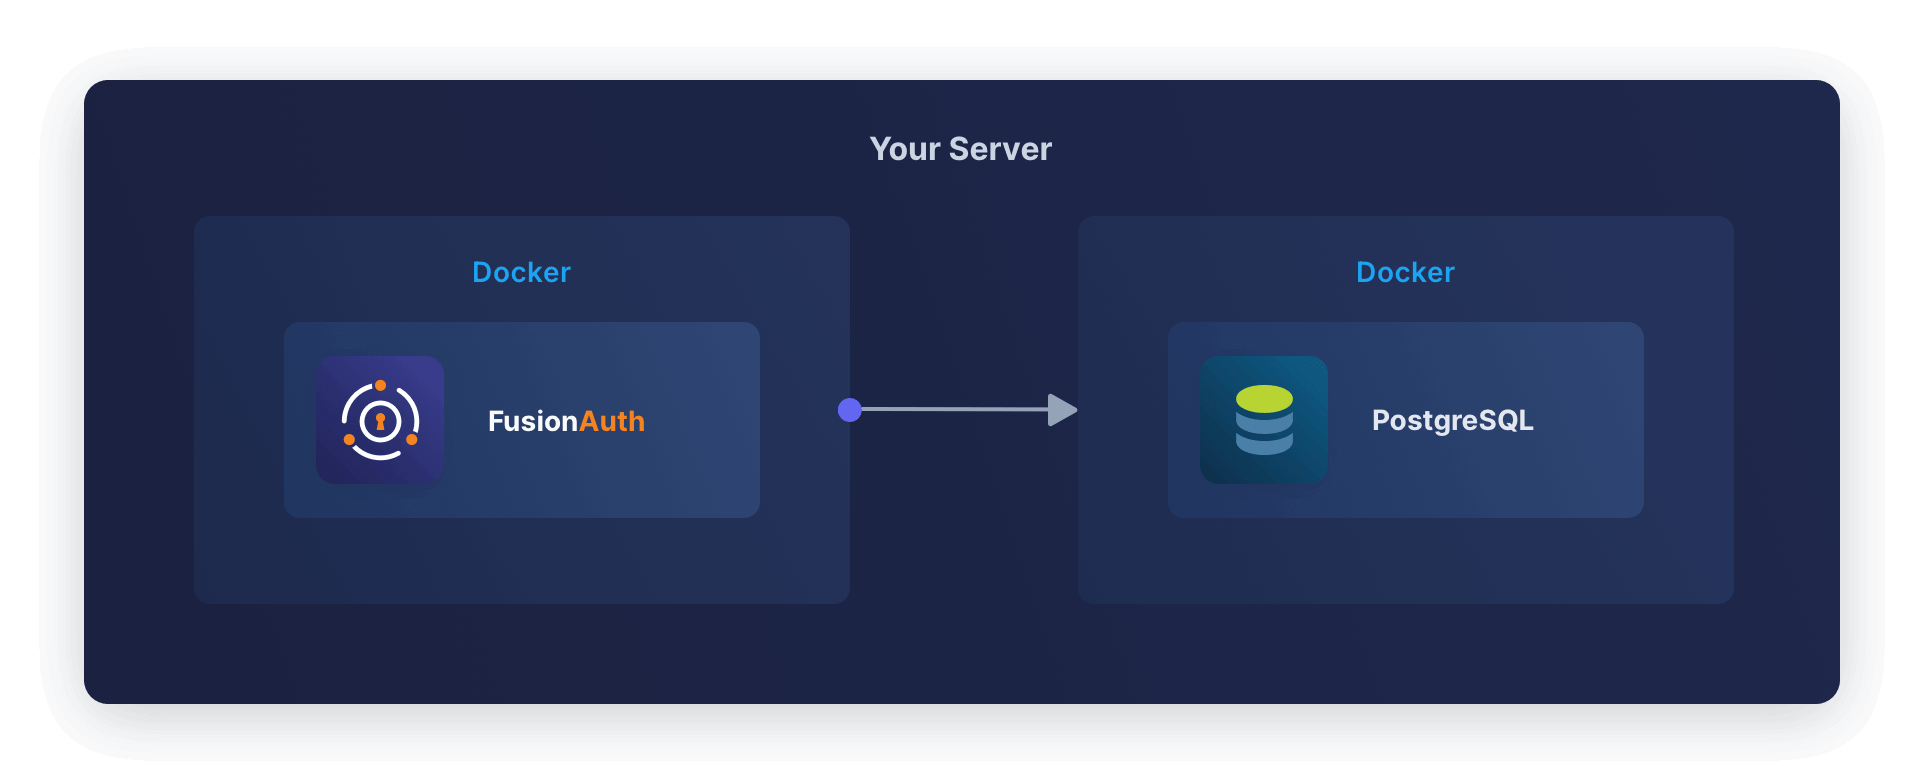
Running FusionAuth and PostgreSQL in Docker usually looks like the diagram below (you might also run OpenSearch in another Docker container).
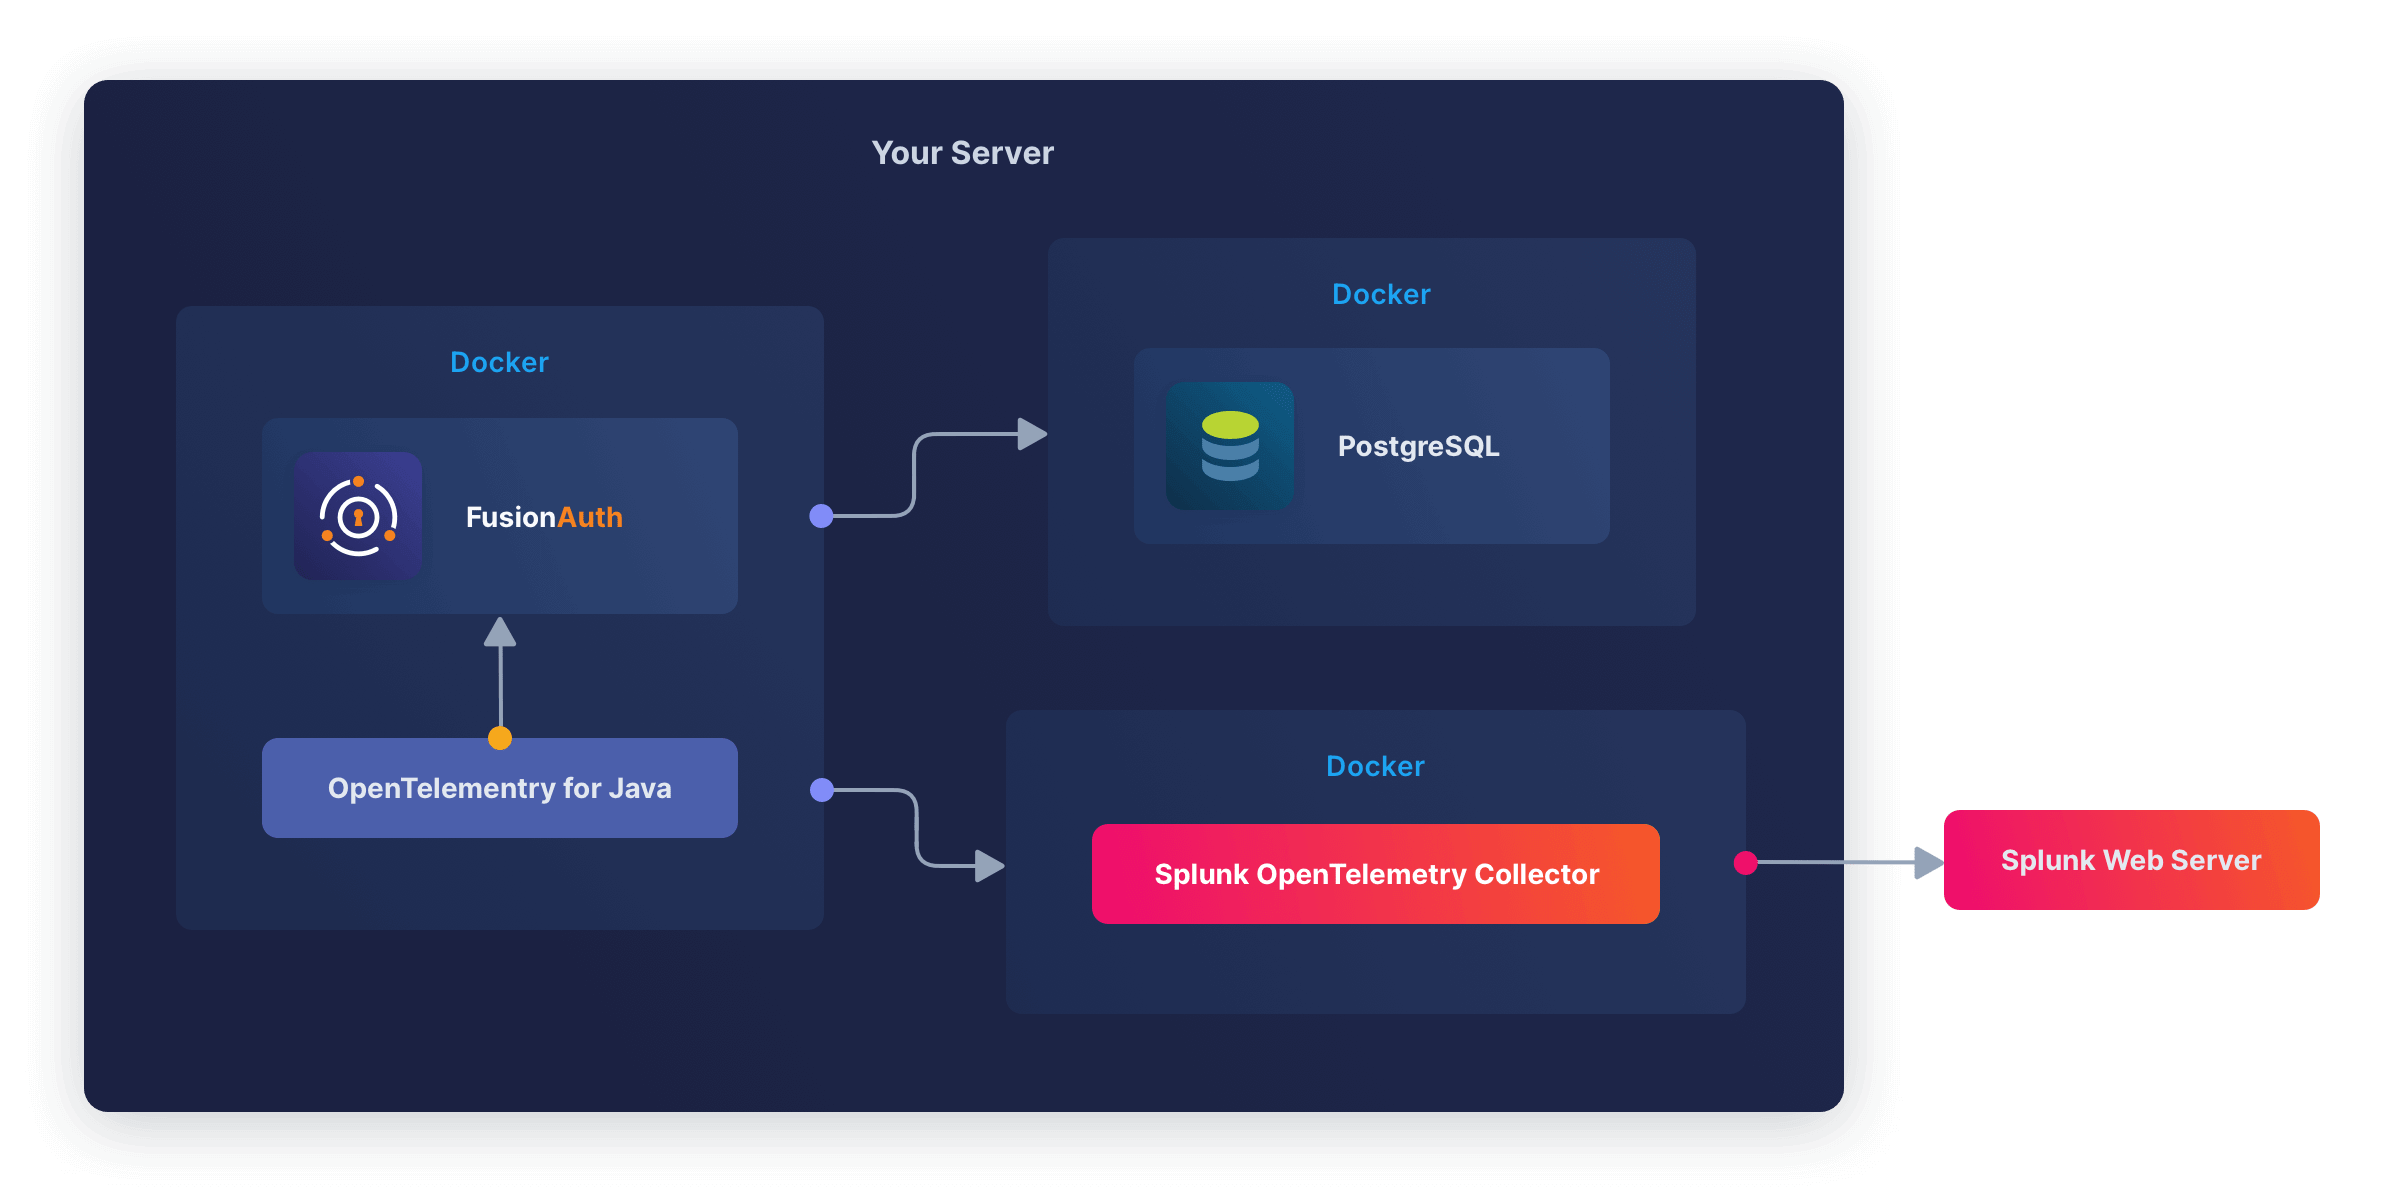
You can also start FusionAuth inside Docker with OpenTelemetry for Java. OpenTelemetry sends the metrics it reads to a collector. The OpenTelemetry Collector runs in a separate Docker container and sends the metrics to Splunk for recording. This follows the Docker principle of one process per container.
This architecture is shown in the diagram below.
The Splunk OpenTelementry Linux Collector tutorial is designed for a physical machine running systemd. Docker containers don't use systemd, as they are designed to host a single process.
Instead, you'll use the OpenTelemetry Collector inside the Docker image Splunk has prepared.
First you need to modify the official FusionAuth Docker image to download the OpenTelemetry Java agent and change the script that starts FusionAuth.
Configuration values for Java OpenTelemetry are described here.
Save the Dockerfile from the FusionAuth containers repo to your computer. Edit the Dockerfile file and insert the following lines above the comment "###### Start FusionAuth App".
##### New for OpenTelemetry #################################
RUN mkdir -p /var/lib/apt/lists/partial \
    && chmod 755 /var/lib/apt/lists/partial \
    && apt update \
    && apt install -y ca-certificates \
    && cd /usr/local/fusionauth \
    && curl -L -o otel.jar https://github.com/open-telemetry/opentelemetry-java-instrumentation/releases/latest/download/opentelemetry-javaagent.jar \
    && (head -n -1 /usr/local/fusionauth/fusionauth-app/bin/start.sh; echo 'exec "${JAVA_HOME}/bin/java" -javaagent:/usr/local/fusionauth/otel.jar -Dotel.resource.attributes=service.name=fusionauth -Dotel.traces.exporter=otlp -Dotel.exporter.otlp.endpoint=http://otel:4318 -cp "${CLASSPATH}" ${JAVA_OPTS} io.fusionauth.app.FusionAuthMain <&- >> "${LOG_DIR}/fusionauth-app.log" 2>&1') > temp.sh \
    && mv temp.sh /usr/local/fusionauth/fusionauth-app/bin/start.sh;
RUN chown fusionauth:fusionauth /usr/local/fusionauth/otel.jar /usr/local/fusionauth/fusionauth-app/bin/start.sh \
    && chmod +x /usr/local/fusionauth/fusionauth-app/bin/start.sh
This script first updates Ubuntu to install basic software that FusionAuth removed to save space. The script then downloads the OpenTelemetry Java app. Next, the script edits start.sh, which is the command run when the container starts, to start FusionAuth with OpenTelemetry. The edit command writes the new command to the end of the start.sh file.
By default, the OpenTelemetry Java agent sends data to the OpenTelemetry Collector at http://localhost:4317. The code above changes this so data is sent to the container at http://otel:4318. (Splunk uses 4317 for RPC, not HTTP.)
Build the Dockerfile into a new image to use in place of the official FusionAuth one.
docker build --platform linux/amd64 -t faimage .Now save the docker-compose.yaml and sample .env files from the FusionAuth containers repo. Update the docker-compose.yaml file to include the Splunk OpenTelemetry container in your compose file by adding the content below. Replace the access token and realm with yours in the otel service. Note that the image on the fa service is also changed to point to the one built in the previous step.
version: '3'

services:
  db:
    image: postgres:latest
    container_name: fa_db
    ports:
      - "5432:5432"
    environment:
      PGDATA: /var/lib/postgresql/data/pgdata
      POSTGRES_USER: ${POSTGRES_USER}
      POSTGRES_PASSWORD: ${POSTGRES_PASSWORD}
    healthcheck:
      test: [ "CMD-SHELL", "pg_isready -U postgres" ]
      interval: 5s
      timeout: 5s
      retries: 5
    networks:
      - db_net
    volumes:
      - db_data:/var/lib/postgresql/data

  fa:
    # image: fusionauth/fusionauth-app:latest
    image: faimage
    container_name: fa
    depends_on:
      db:
        condition: service_healthy
    environment:
      DATABASE_URL: jdbc:postgresql://db:5432/fusionauth
      DATABASE_ROOT_USERNAME: ${POSTGRES_USER}
      DATABASE_ROOT_PASSWORD: ${POSTGRES_PASSWORD}
      DATABASE_USERNAME: ${DATABASE_USERNAME}
      DATABASE_PASSWORD: ${DATABASE_PASSWORD}
      FUSIONAUTH_APP_MEMORY: ${FUSIONAUTH_APP_MEMORY}
      FUSIONAUTH_APP_RUNTIME_MODE: ${FUSIONAUTH_APP_RUNTIME_MODE}
      FUSIONAUTH_APP_URL: http://fusionauth:9011
      SEARCH_TYPE: database
      FUSIONAUTH_APP_KICKSTART_FILE: ${FUSIONAUTH_APP_KICKSTART_FILE}
    networks:
      - db_net
    ports:
      - 9011:9011
    volumes:
      - fusionauth_config:/usr/local/fusionauth/config
      - ./kickstart:/usr/local/fusionauth/kickstart
    extra_hosts:
      - "host.docker.internal:host-gateway"

  otel:
    image: quay.io/signalfx/splunk-otel-collector:latest
    container_name: fa_otel
    environment:
      SPLUNK_ACCESS_TOKEN: "<your-splunk-access-token>"
      SPLUNK_REALM: "us1"
      SPLUNK_LISTEN_INTERFACE: "0.0.0.0"
      SPLUNK_MEMORY_LIMIT_MIB: "1000"
      SPLUNK_CONFIG: /config.yaml
    volumes:
      - ./config.yaml:/config.yaml
    networks:
      - db_net
    # no host ports are needed as communication is inside the Docker network
    # ports:
    #   - "13133:13133"
    #   - "14250:14250"
    #   - "14268:14268"
    #   - "4317:4317"
    #   - "4318:4318"
    #   - "6060:6060"
    #   - "7276:7276"
    #   - "8888:8888"
    #   - "9080:9080"
    #   - "9411:9411"
    #   - "9943:9943"

networks:
  db_net:
    driver: bridge

volumes:
  db_data:
  fusionauth_config:
Save the sample Splunk configuration file to a file called config.yaml on your computer in the same folder as the docker-compose.yaml file. You are using the Splunk collector in gateway mode (data forwarding), not agent mode (host monitoring). The host monitoring is done by the Java agent running in the FusionAuth Docker instance.
The config.yaml configuration file path is added as the SPLUNK_CONFIG: /config.yaml environment variable in the above Docker compose file.
Now check whether the OpenTelemetry container can send data to Splunk. First run the command below.
docker compose up otelOn the Splunk website, go to the Metric Finder section and search for otel to see if any data is visible. Even when FusionAuth is not running, the collector will send basic data to Splunk.
If no data is sent, correct your access token and realm in the compose file.
Now that you are sure the Splunk connection works, stop the otel container with Ctrl+C and run docker compose up to start all three containers. It may take 30 seconds for all the containers to start, but after that, the terminal output should show data being sent to Splunk.
OpenTelemetry Dashboard#
Create a dashboard to view all the data from FusionAuth.
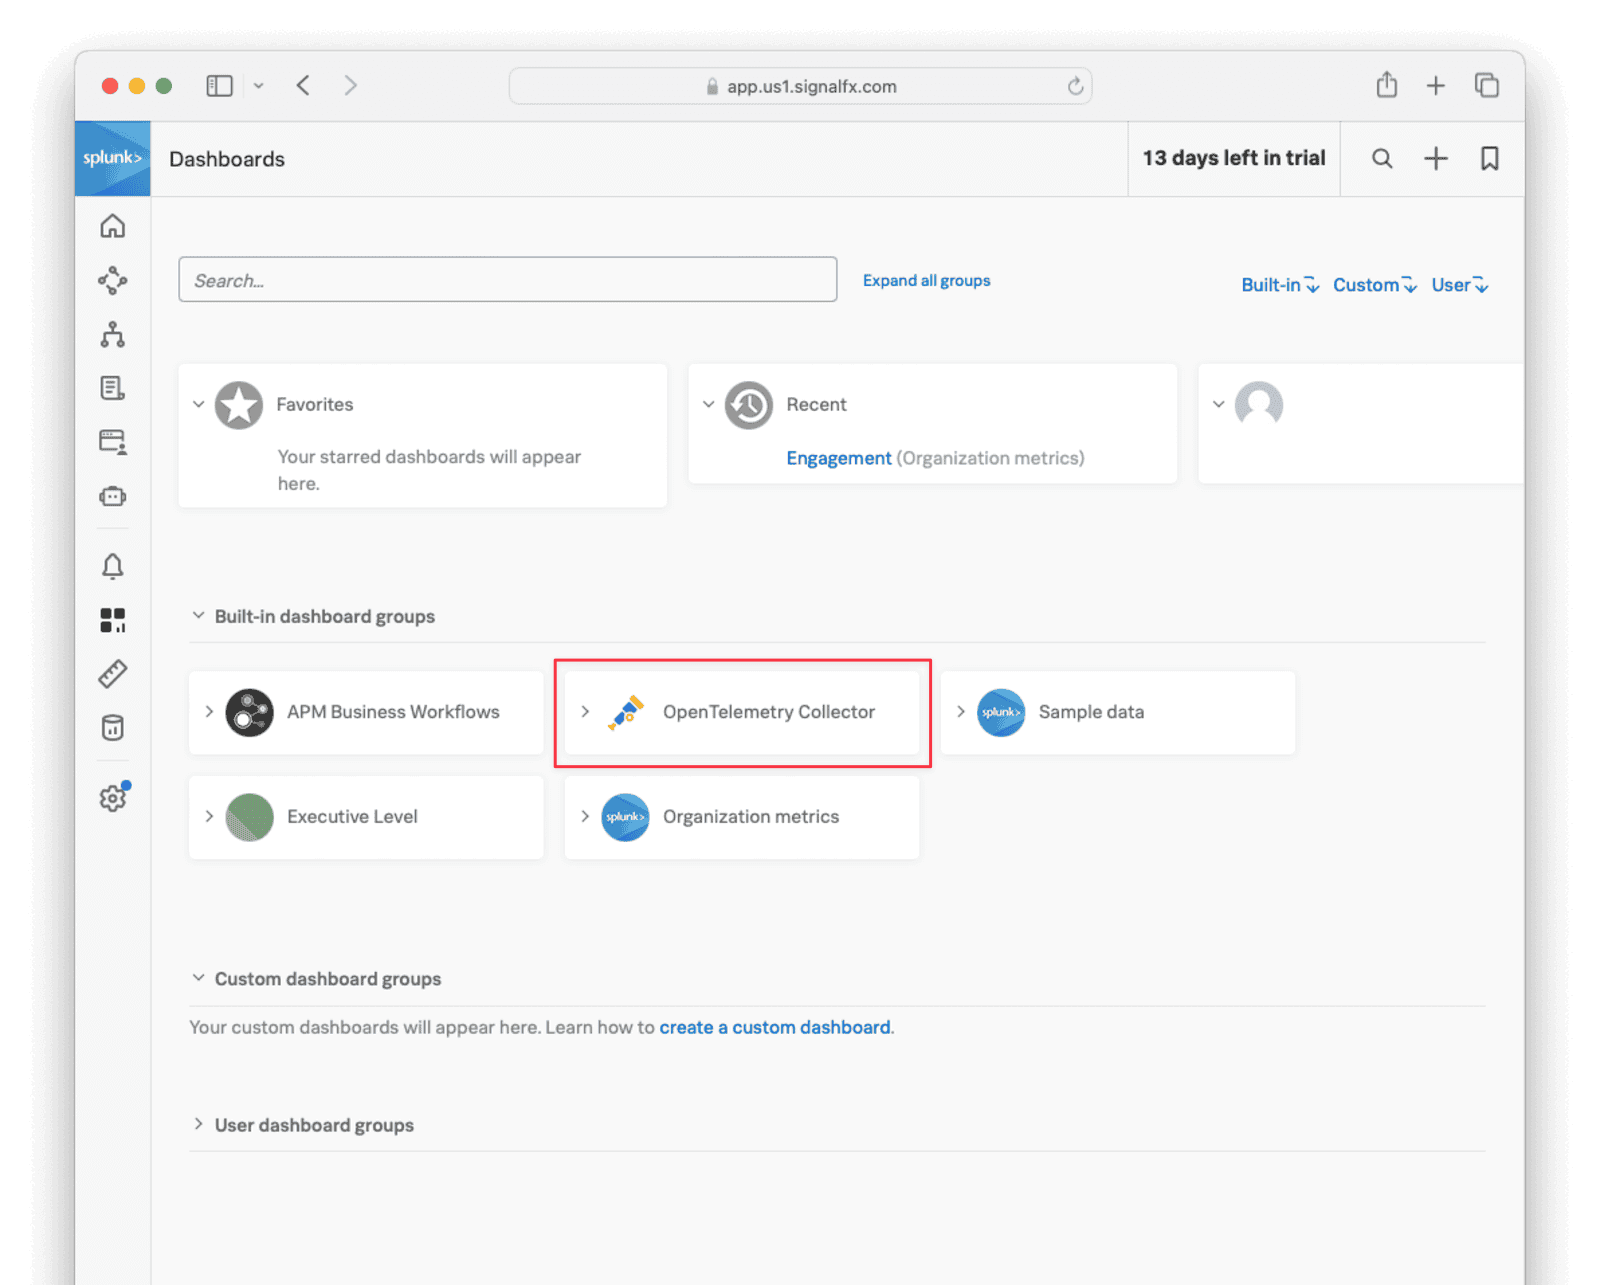
Browse to https://app.us1.signalfx.com/#/dashboards (remember to replace us1 with your realm). Choose the OpenTelemetry Collector dashboard from the Built-in dashboard groups . (This dashboard will appear as an option only if you have set up the collector in the previous section.)
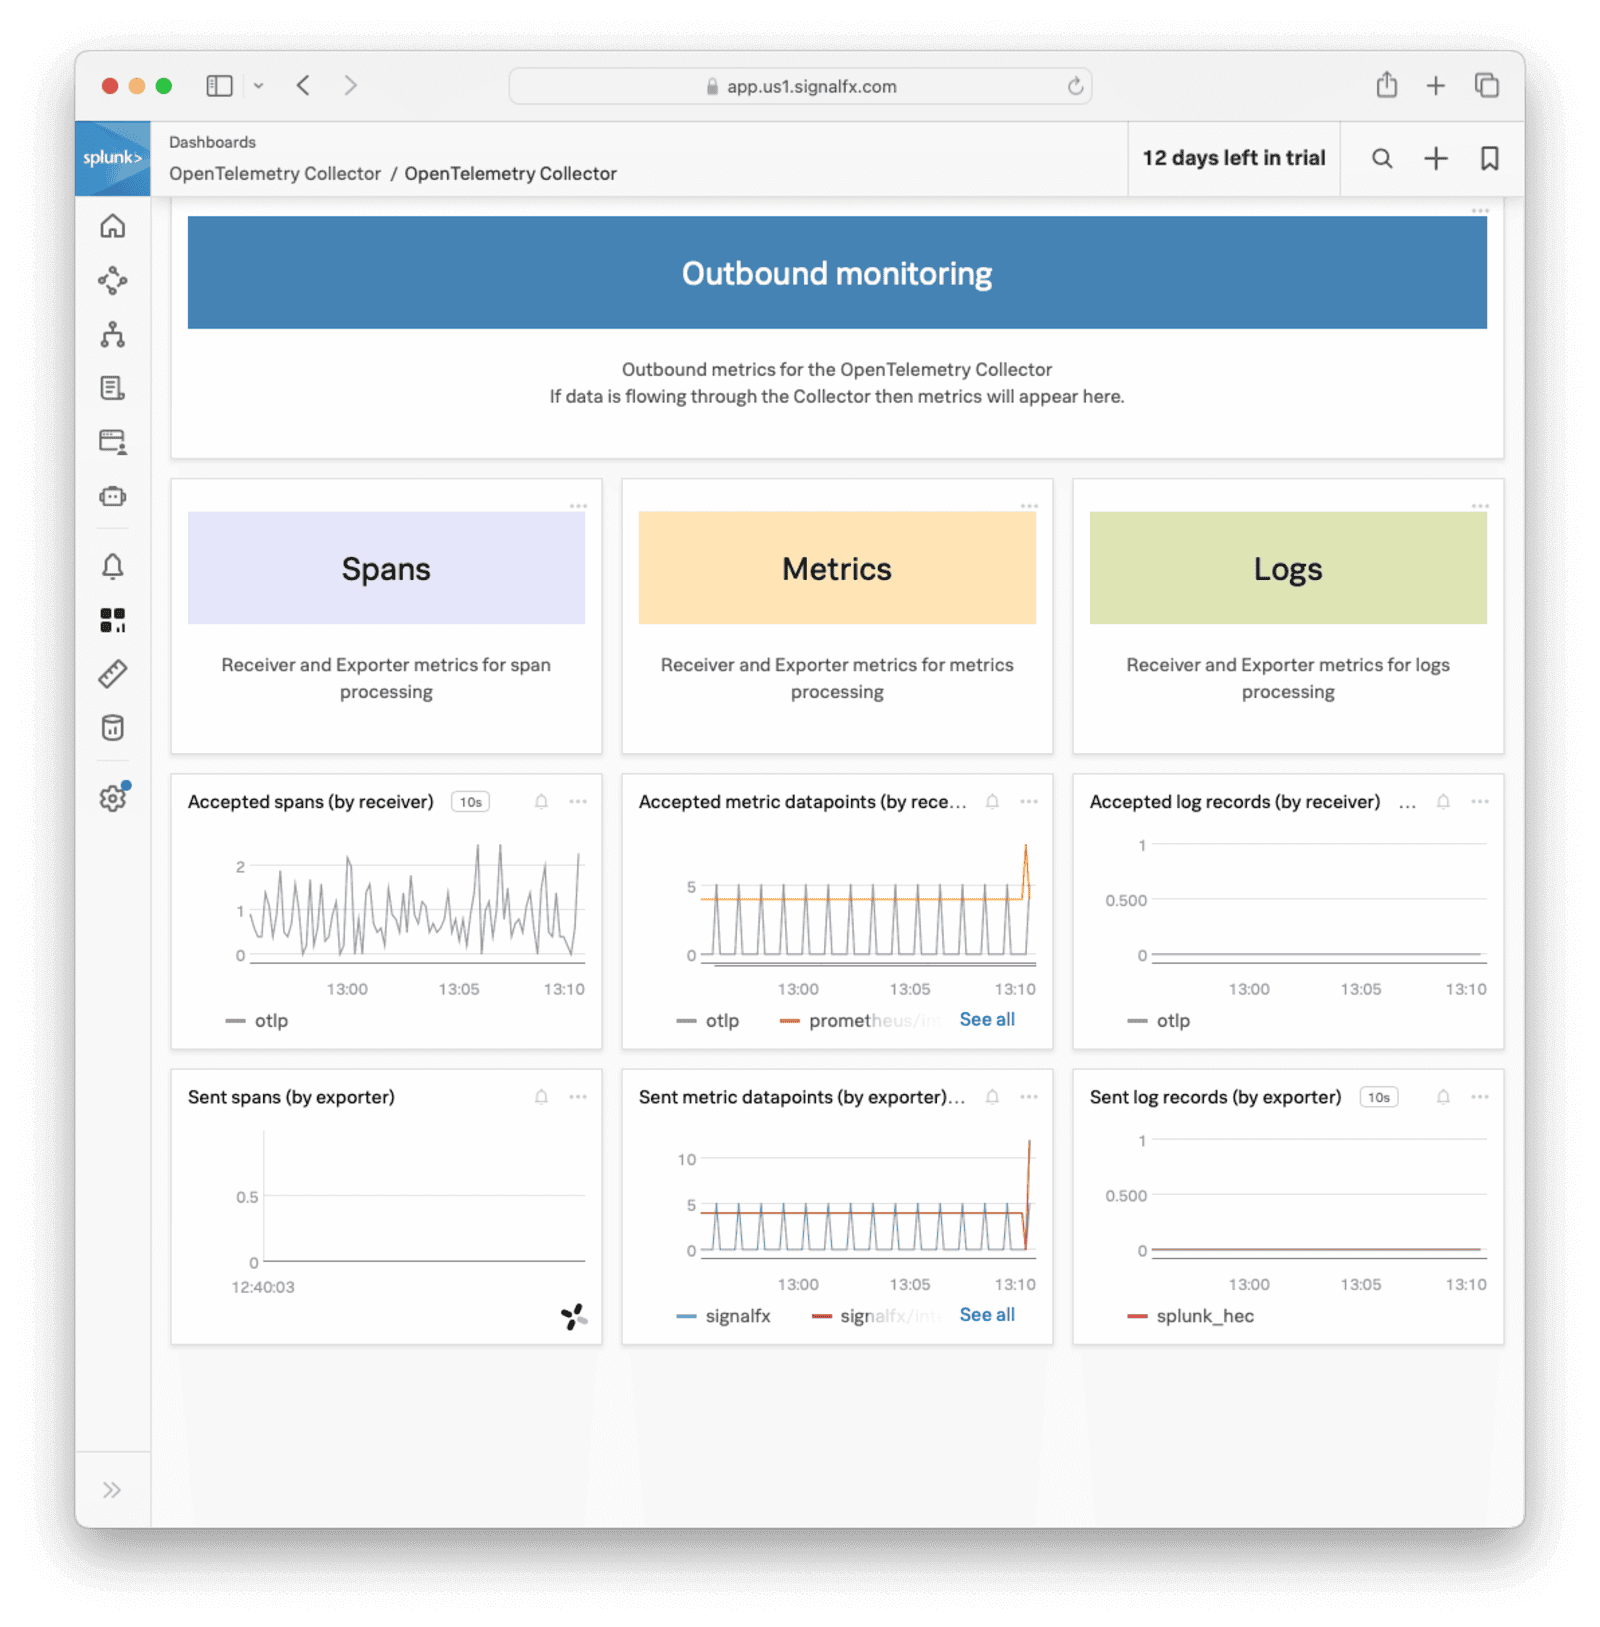
At the top, set the time to the past day to ensure that you see all possible values while testing.
While FusionAuth is running, you should see a dashboard like the image below.
FusionAuth Metrics#
Now you know how to send Splunk Java metrics with OpenTelemetry, let's consider what custom metrics you would want to send and how to write code that uploads the metrics automatically while FusionAuth is running.
Counts, Not Details#
Note that Splunk is designed to monitor aggregate data, in other words, counts of events. Splunk can group those counts over time and by dimension (location, server, or application). Splunk is not designed to monitor individual events with details like error messages or the names of the most purchased products on your site.
For FusionAuth, this means you should use Splunk to check how many people are logging in over time, not which people. Think of it like this: If your data can be used in a gauge or bar chart, it's the right type of data.
While it's true that Splunk does have a log file tracking product and many other services, this article discusses only the Observability Cloud.
Which Metrics To Monitor#
FusionAuth has too many metrics to discuss in this article. You will need to decide which are important for you to monitor by reading the documentation.
In addition to the metrics available through the various FusionAuth APIs, you can create your own metrics using any event that can trigger a webhook. This webhook can call another Docker container you create that listens for incoming events and forwards them to Splunk.
A useful metric to start with is login counts. If this number drops from the average, it's a good sign something might be wrong with your system. In this guide, you'll learn how to create a program that uses the FusionAuth API to get the login count, then upload it to Splunk.
You can add any other metrics you want to this system.
Mapping FusionAuth Metrics To Splunk Metrics#
Splunk has two sets of documentation, the primary and the developer documentation. You need to read only the primary documentation to use Splunk with FusionAuth. The only exception is the documentation on the data format expected by Splunk if you're uploading data with their REST API.
Splunk has four different metric types:
| Type | Description |
|---|---|
| Gauge | Value of a measurement at a specific point in time. |
| Cumulative counter | Total number of occurrences or items since the measurement began. |
| Counter | Number of new occurrences or items since the last measurement. |
| Histogram | Distribution of measurements across time. Splunk Observability Cloud supports explicit bucket histograms. |
Let's consider the number of user logins every ten seconds as an example. If you have only a few users, you could monitor the number every hour or even every day instead.
You could send the number of logins to Splunk as a:
- Gauge: Monitoring this would involve seeing that the gauge number on the dashboard doesn't change much.
- Cumulative counter: Monitoring this would involve seeing that the number is steadily increasing.
- Counter: In this case, the metric would function the same as a gauge.
Using a histogram isn't necessary for such simple data.
Write A Custom Service To Send Data To The API#
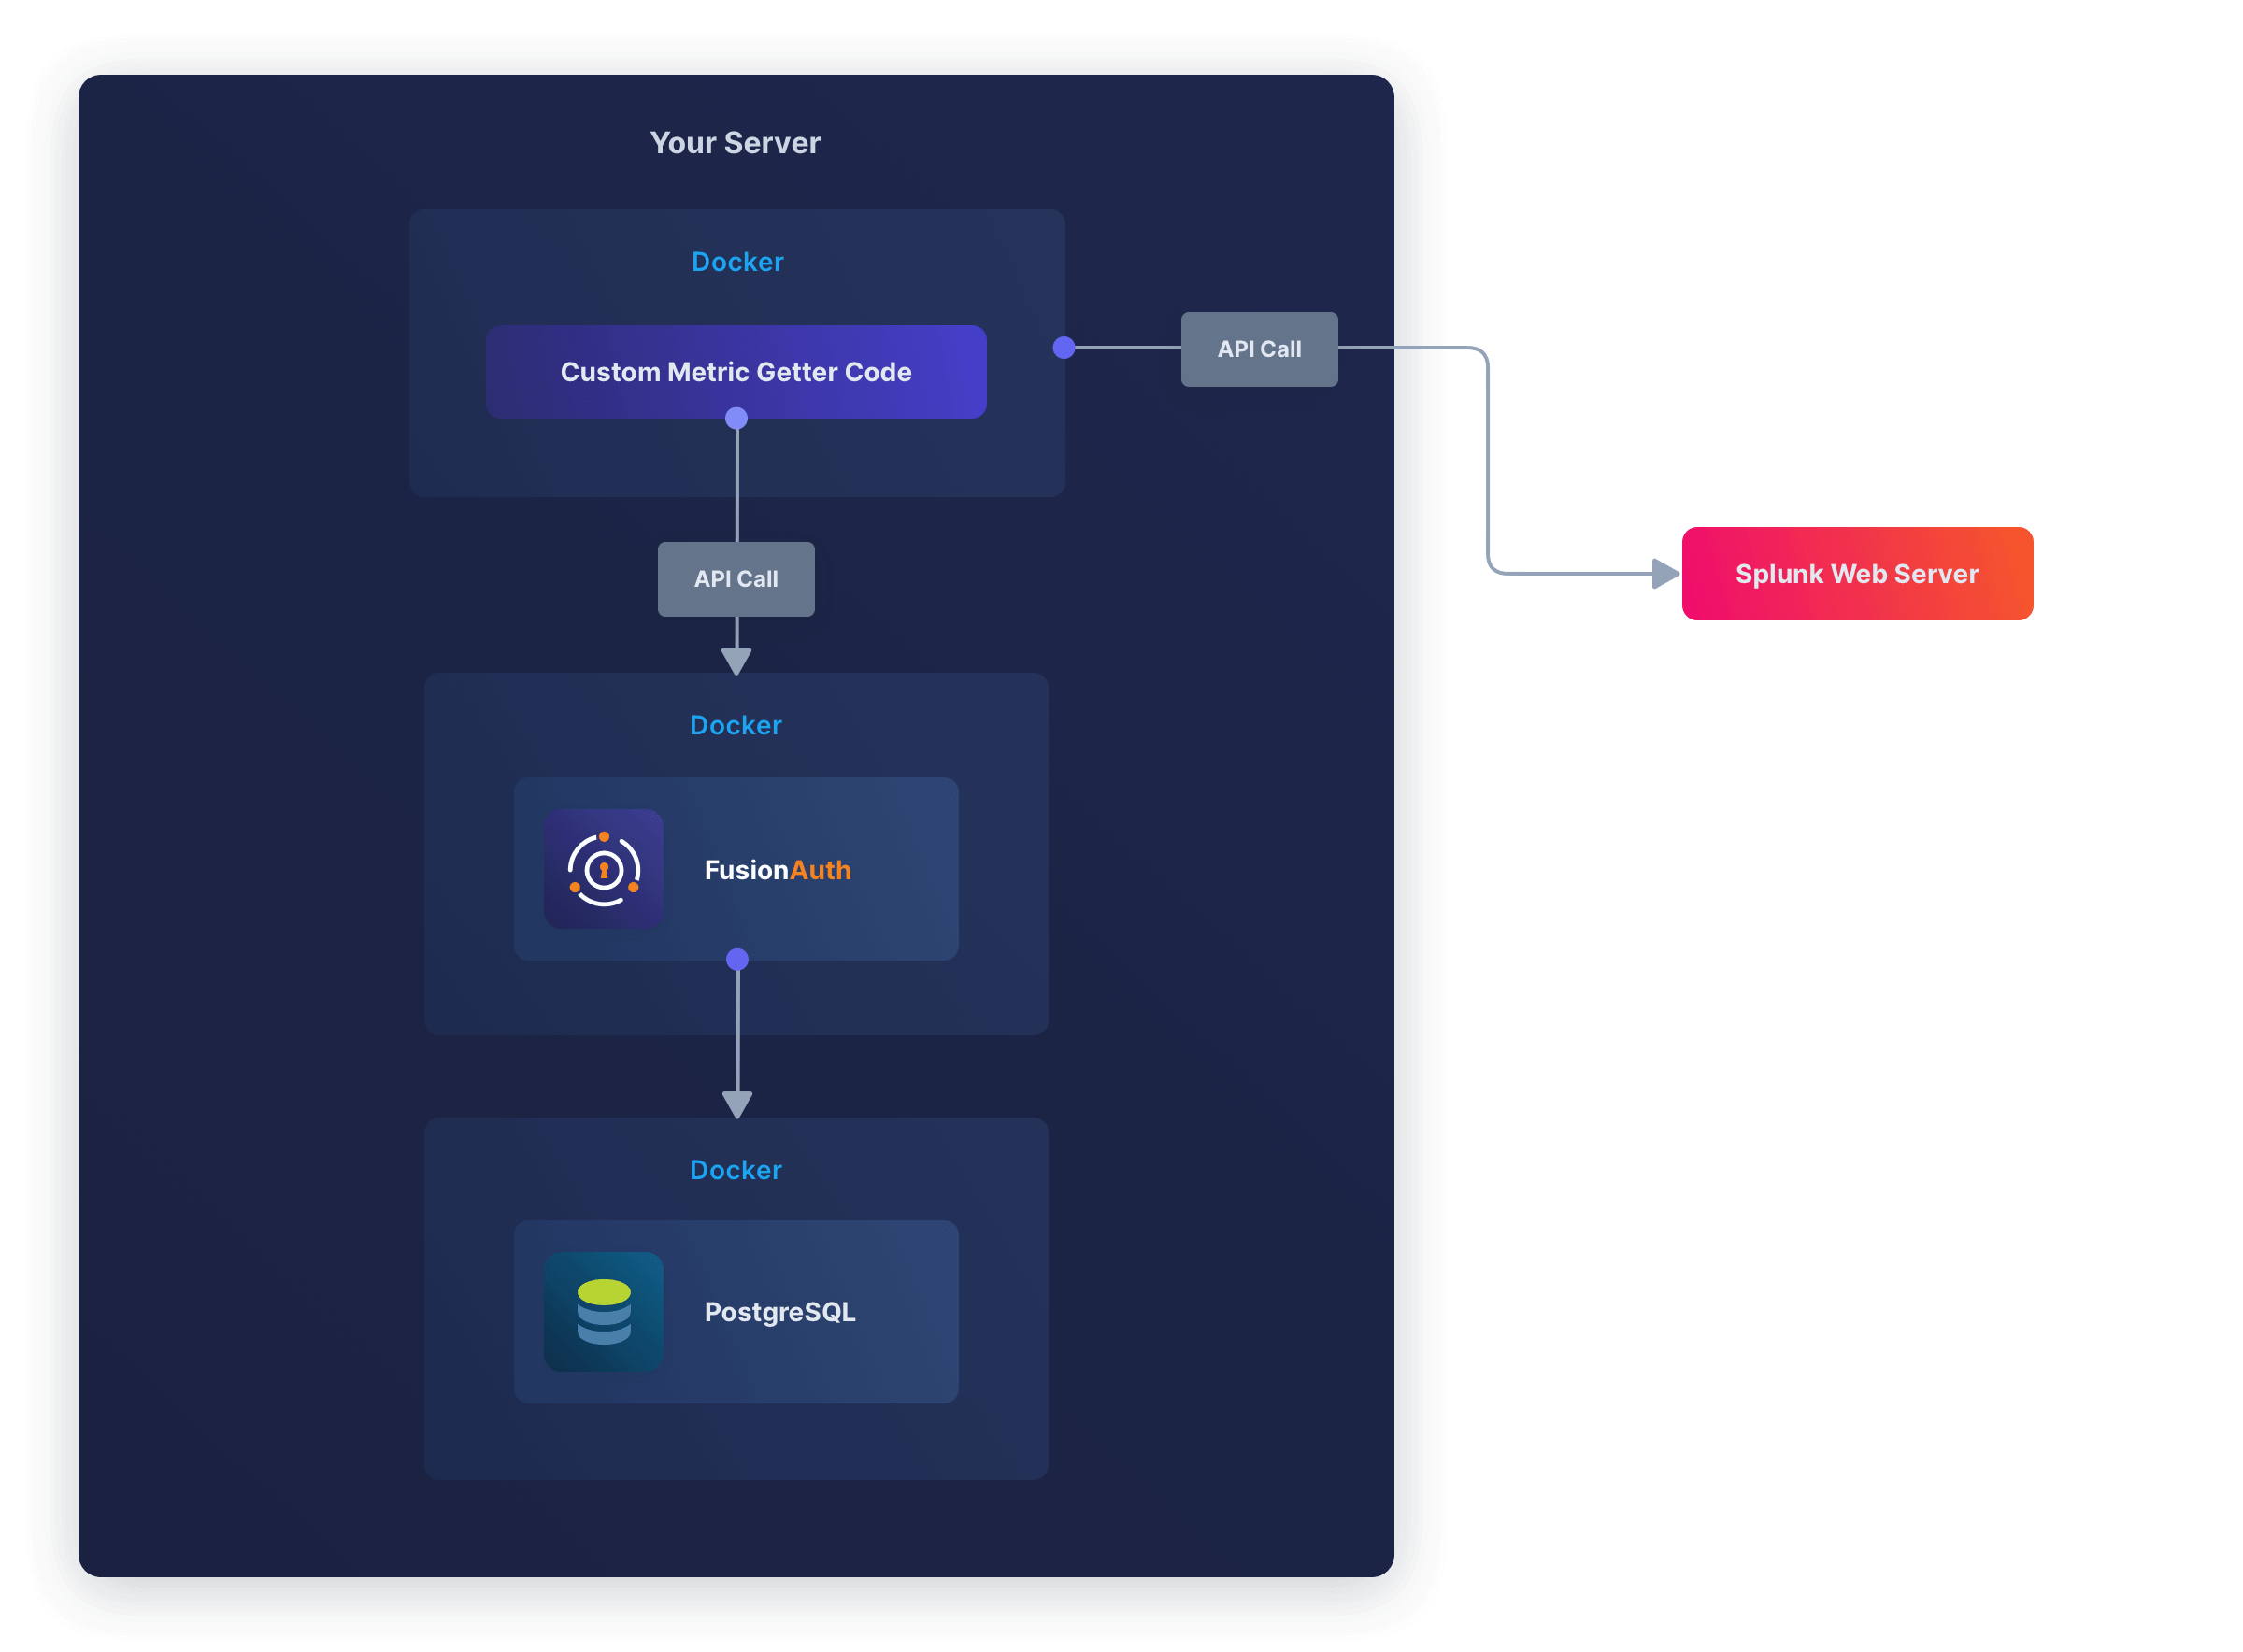
Previously, this guide showed you how to use a new Docker container to run an OpenTelemetry Collector to receive data from FusionAuth. In this section, you will create another Docker container to call the FusionAuth API and send the metrics to Splunk.
The system looks like the diagram below.
Let's get the login records every ten seconds and send them to Splunk. All the FusionAuth APIs that give you event data are documented here. The login records API is documented here. Note that the documentation says the date format is the standard Java type, but some constants like ISO_LOCAL_DATE_TIME are not supported. You need to enter the format string you want manually.
Unfortunately, all the APIs export events as zip files — you will not get JSON or YAML data in memory. So you will need to create a script that gets the zip file, extracts it, reads it, formats the entries for Splunk, and uploads them.
Browse to FusionAuth, which is at http://localhost:9011 if you are running through the default Docker setup. Log in and look for your application Id in System -> Login Records .
Next, create an API key by navigating to Settings -> API Keys and clicking the button. Enter a Description for the API key and click on the button to save the API key. On the API Keys list page, click the red lock next to the newly generated key to reveal the key value and copy and save it.
Create a file called app.sh. Insert the content below, replacing your FusionAuth API key in key and FusionAuth application Id in appId, and your Splunk access token and Splunk realm in the curl command at the end.
#!/bin/sh

# exit on error
set -e

# get login records from FusionAuth
endpoint="http://fa:9011/api/system/login-record/export"
# FusionAuth API key
key="33052c8a-c283-4e96-9d2a-eb1215c69f8f-not-for-prod"
# FusionAuth application Id
appId="3c219e58-ed0e-4b18-ad48-f4f92793ae32"
dateFormat=$(echo -n "yyyy-MM-dd'T'HH:mm:ss.SSS" | jq -sRr @uri)
end=$(date +%s)000
start=$(($end - 3600000))
params="applicationId=${appId}&dateTimeSecondsFormat=${dateFormat}&start=${start}&end=${end}"
url="${endpoint}?${params}"
echo "curl -H \"Authorization: ${key}\" -o record.zip \"$url\""
curl -H "Authorization: ${key}" -o record.zip "$url"
unzip record.zip -o
cat login_records.csv

# for each record, get the unix time in ms
tail -n +2 login_records.csv | while IFS=',' read -r userId time rest; do
  userId=$(echo "$userId" | tr -d ' "' )
  time=$(echo "$time" | tr -d ' "')                      # 2024-06-21T05:14:56.123
  time=$(echo "$time" | tr 'T' ' ')                      # 2024-06-21 05:14:56.123
  sec="$(date -d "$(echo $time | cut -d '.' -f 1)" +%s)" # 1718946896
  ms="$(echo $time | cut -d '.' -f 2)"                   # 123

  # make the POST data
  data=$(cat <<EOF
{
  "cumulative_counter": [
    {
       "metric": "login.success",
       "dimensions": { "host": "testServer" },
       "value": 1,
       "timestamp": ${sec}${ms}
    }
  ]
}
EOF
)

  # send data to Splunk API
  curl --request POST -H "X-SF-TOKEN: yourToken" -H "Content-Type: application/json" -d "$data" "https://ingest.us1.signalfx.com/v2/datapoint"

done
This script gets all login records in the last hours to be sure the zip file has some data. In reality, replace 3600000 with 10000 so that when the script runs every ten seconds, it gets only the latest records. Note that FusionAuth uses milliseconds instead of the epoch standard of seconds, so the script has to append 000 to the normal Unix time.
The file returned from FusionAuth unzips to login_records.csv, which looks like the data below.
| "User Id " | "Time " | "Application Id " | "IP Address " | "City " | "Country " | "Zipcode " | "Region " | "Latitude " | "Longitude " |
|---|---|---|---|---|---|---|---|---|---|
| ba81f3e2-3b0f-4d64-930f-38298de9dc0d | 2024-06-21T05:14:56.123 | 3c219e58-ed0e-4b18-ad48-f4f92793ae32 | 172.20.0.1 | ||||||
| ba81f3e2-3b0f-4d64-930f-38298de9dc0d | 2024-06-21T05:07:06.406 | 3c219e58-ed0e-4b18-ad48-f4f92793ae32 | 172.20.0.1 |
The records in this file look different from those in the FusionAuth console. Only Ids are given here, not email addresses or application names.
The second half of the script reads in the CSV file, discards the header, and sends a value of 1 and the time of each login to Splunk.
Create a file called metricDockerfile. Insert the content below.
FROM --platform=linux/amd64 alpine:3.19
RUN apk add --no-cache curl jq vim
COPY app.sh /app.sh
RUN chmod +x app.sh
CMD watch -t -n 10 /app.sh
Build the container with the command below.
docker build -f metricDockerfile --platform linux/amd64 -t metricimage .Edit your docker-compose.yaml file and add the new service as follows.
  fametric:
    image: metricimage
    container_name: fametric
    networks:
      - db_net
Now run all the containers with docker compose up.
The output should be as below. Since you logged in within the last hour, there will be one row in the exported file and one value will be sent to Splunk.
curl -H "Authorization: 33052c8a-c283-4e96-9d2a-eb1215c69f8f-not-for-prod" -o record.zip "http://fa:9011/api/system/login-record/export?applicationId=3c219e58-ed0e-4b18-ad48-f4f92793ae32&dateTimeSecondsFormat=yyyy-MM-dd%27T%27HH%3Amm%3Ass.SSS&start=1719216315000&end=1719219915000"
fametric  |   % Total    % Received % Xferd  Average Speed   Time    Time     Time  Current
fametric  |                                  Dload  Upload   Total   Spent    Left  Speed
100   310    0   310    0     0  41026      0 --:--:-- --:--:-- --:--:-- 44285
fametric  | Archive:  record.zip
fametric  |   inflating: login_records.csv
fametric  | "User Id ","Time ","Application Id ","IP Address ","City ","Country ","Zipcode ","Region ","Latitude ","Longitude "
fametric  | 00000000-0000-0000-0000-000000000001,2024-06-24T02:19:04.054,3c219e58-ed0e-4b18-ad48-f4f92793ae32,172.20.0.1,,,,,,
fametric  |   % Total    % Received % Xferd  Average Speed   Time    Time     Time  Current
fametric  |                                  Dload  Upload   Total   Spent    Left  Speed
100   173  100     4  100   169      2    112  0:00:02  0:00:01  0:00:01   114
On your Splunk web interface, browse to Metric Finder . Search for login.success. Click on the result and on the resulting chart, set the "Time" field to -1d and the chart type to column.
If the metric has not uploaded correctly, you can debug the container by running docker exec -it fametric sh in a new terminal. Once in the container, you can alter the script with vim /app.sh. Add -v to the curl command to see verbose output. Run the script with /app.sh.
If you have trouble calling the FusionAuth API, review the troubleshooting tips.
If you alter app.sh in your host machine and want to rerun the containers, use the command below.
clear; docker build -f metricDockerfile --platform linux/amd64 -t metricimage .; docker compose upYou can follow the process described here to add other FusionAuth API calls to app.sh to get other metrics to send to Splunk.