Monitor With OpenTelemetry
Introduction#
This guide explains how to monitor FusionAuth with OpenTelemetry.
OpenTelemetry is an open-source framework (suite of apps) and a protocol for collecting information about a running application.
You can either use an OpenTelemetry library as a module in your code, which you call manually to send it application-specific metrics (instrumentation), or you can use a stock OpenTelemetry instrumentation agent, like the Java Virtual Machine agent, that collects general information about your application as it runs.
You could also collect metrics about your application through another tool and send them to an OpenTelemetry Collector service through OTLP (OpenTelemetry Protocol), a standardized way of exchanging telemetry data between tools. The collector acts as a central point to receive all metrics, potentially do some simple filtering, and forward the metrics to other services.
OpenTelemetry does not handle storage, data aggregation (counting things), or visualization (dashboards).
For example, you could run the OpenTelemetry Java agent before running your app. The agent would monitor the RAM use of your app as a metric and send it to an OpenTelemetry Collector, which would forward the metric to another service for saving, counting, and displaying in a dashboard.
Please read the FusionAuth monitoring overview before proceeding. The overview explains the FusionAuth metrics, the activities that comprise a complete monitoring workflow, and the tools that complement OpenTelemetry, such as Prometheus and Elastic (which have their own FusionAuth guides). Review the alternative monitoring services in the overview to ensure that OpenTelemetry is the right tool for your needs.
FusionAuth doesn’t support OpenTelemetry instrumentation for traces. For more information and to find status, see the open GitHub issue to add instrumentation for traces.
Architecture For Using OpenTelemetry With FusionAuth#
Running FusionAuth and PostgreSQL in Docker usually looks like the diagram below (you might also run OpenSearch in another Docker container).
graph LR
  subgraph I[Your server]
    direction TB
    subgraph G[Docker]
      H[(PostgreSQL)]
    end
    subgraph C[Docker]
      A(FusionAuth)
    end
    subgraph E[Docker]
      F(Your app)
    end
  end
  D(User)
  D --> F
  D --> A
  C --> G
  F --> A
  style I fill:#999
This diagram shows three components that could die and need monitoring: the PostgreSQL database, FusionAuth, and your app (web server) that directs users to FusionAuth for login. In this guide, you’ll focus on monitoring FusionAuth.
The tool you’ll use to monitor FusionAuth is the OpenTelemetry Collector. It consists of two types of components:
- A receiver, which monitors a container or application and either directly produces its metrics or receives its metrics from another tool.
- An exporter, which exposes these metrics to other tools.
The Collector can also process the values it receives before exporting them.
Since you don’t have access to the FusionAuth source code, there are three ways you can use OpenTelemetry to export FusionAuth metrics:
- Run an OpenTelemetry exporter inside the FusionAuth Docker container to monitor the Java Virtual Machine (JVM) in which FusionAuth runs. The FusionAuth team does not recommend this approach. You have to alter the provided Docker image to include the Java agent and to alter the image every time FusionAuth releases an update. The metrics the JVM provides also do not provide any useful information beyond the data provided by monitoring the container itself.
- Run an OpenTelemetry exporter in its own Docker container on your host. This will allow you to know whether FusionAuth is up and receive basic container health metrics, like CPU and RAM use. Usually, the OpenTelemetry container requires administrative permissions to the Docker engine to get metrics about the FusionAuth container status, but OpenTelemetry can read metrics in the older Prometheus format provided by FusionAuth, so administrative permissions aren’t required in this case.
- Write a custom script to request metrics from the FusionAuth API and forward them to an OpenTelemetry collector. This will allow you to monitor specific FusionAuth metrics, like application errors and user login rates.
In this guide, you’ll set up the last two options.
If you are not using a paid cloud service, you will need to install Prometheus to view the OpenTelemetry metrics. That installation is explained briefly in this guide, but please work through the Prometheus monitoring guide too. OpenTelemetry also monitors more than Prometheus — OpenTelemetry can trace an entire web request across services, instead of recording only a metric at a point in time.
So why use OpenTelemetry if you are not using a paid monitoring service, do not need to trace requests inside FusionAuth, and could just use Prometheus by itself? For most FusionAuth users, there probably isn’t any reason to use OpenTelemetry — Prometheus alone should be enough to monitor whether FusionAuth is up and running correctly. The only advantage running an OpenTelemetry collector offers is that it allows you to write a script that requests custom metrics (like user login counts) from the FusionAuth API and sends them through the OpenTelemetry collector to Prometheus, so you can get more detail about specific FusionAuth processes than you can get from Prometheus alone.
If you’re wondering how Prometheus can poll the OpenTelemetry Collector for metrics if the Collector doesn’t store metrics, it’s because the Collector keeps recently received metrics in RAM. However, the Collector does not store them for long or persist metrics to disk.
In the following sections of this guide, you will run:
- The OpenTelemetry Collector in Docker to poll the FusionAuth Prometheus endpoint
- A bash script in another container to poll the FusionAuth API to get data about user logins
- Prometheus in a final container to receive both the OpenTelemetry metrics
graph LR
  D(User)
  subgraph I[Your server]
    subgraph G[Docker]
      H[(PostgreSQL)]
    end
    subgraph C[Docker]
      A(FusionAuth)
    end
    subgraph P[Docker]
      Q(OpenTelemetry Collector)
    end
    subgraph E[Docker]
      B(Prometheus)
    end
    subgraph K[Docker]
      L(bash script)
    end
    subgraph J[Docker]
      F(Your app)
    end
  end
  D --> J
  D --> C
  C --> G
  F --> C
  K --> |pushes metrics to| P
  E --> |pulls metrics from| P
  P --> |pull Prometheus metrics from| C
  K --> |pull custom metrics from| C
  style I fill:#999
  style E fill:#944
  style K fill:#944
  style P fill:#944
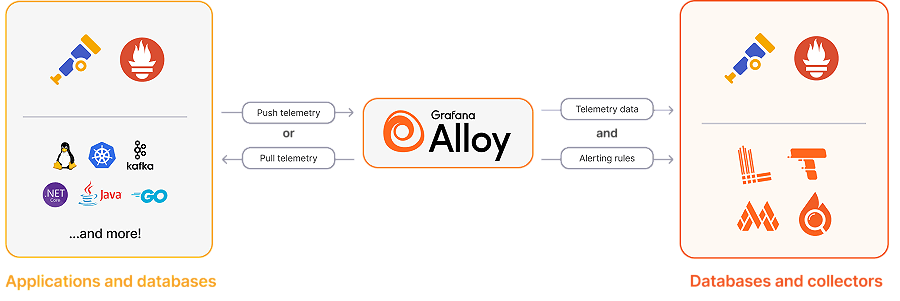
This guide focuses on OpenTelemetry, not Prometheus and Grafana, and so uses the OpenTelemetry Collector. However, as of 2024, Grafana has released their own free and open-source version of an OpenTelemetry collector, called Alloy, that supports all Prometheus and OpenTelemetry protocols. It is component-based and has features that the OpenTelemetry Collector does not. You may prefer to use Alloy instead of OpenTelemetry Collector in your project.
Run OpenTelemetry With Docker To Monitor FusionAuth#
In this section, you will run FusionAuth, poll metrics from it with OpenTelemetry, and store those metrics in Prometheus.
Clone the sample FusionAuth kickstart repository with the command below.
git clone https://github.com/FusionAuth/fusionauth-example-docker-compose.git
cd fusionauth-example-docker-compose/light
The docker-compose.yml file currently starts FusionAuth and its database.
Add the two new services to the bottom of docker-compose.yml, before the networks: section, with the code below.
  otel:
    image: otel/opentelemetry-collector
    container_name: faOtel
    platform: linux/amd64
    depends_on:
      - fa
    ports:
      - 8889:8889
      - 4318:4318
    volumes:
      - ./collectorConfig.yml:/etc/otel-collector-config.yml
    networks:
      - db_net
    command: ["--config=/etc/otel-collector-config.yml"]


  prometheus:
    image: ubuntu/prometheus:2.52.0-22.04_stable
    container_name: faProm
    platform: linux/amd64
    depends_on:
      - otel
    ports:
      - 9090:9090
    volumes:
      - ./prometheusConfig.yml:/etc/prometheus/prometheus.yml
      - ./prometheusDb:/prometheus
    networks:
      - db_net
All containers in the configuration file are on the same network db_net.
The second service definition specifies that the Prometheus image starts after the OpenTelemetry Collector, that you can browse to Prometheus on port 9090, and that it will save its database and configuration file in persistent directories on your machine.
The first service definition states that the OpenTelemetry image comes from https://hub.docker.com/r/otel/opentelemetry-collector. Alternatively, you can use a contrib image instead. The image is bigger and contains more components that interoperate with other OpenTelemetry tools you may want to use. The ports exposed in the configuration are 8889, which Prometheus uses to pull metrics from OpenTelemetry Collector, and 4318, which the Collector uses to receive custom metrics.
The volumes and command lines provide a configuration file for the Collector. Now, let’s make that file, collectorConfig.yml, with the content below.
receivers:
  prometheus:
    config:
      scrape_configs:
        - job_name: 'fusionauth'
          scrape_interval: 15s
          scheme: http
          metrics_path: api/prometheus/metrics
          static_configs:
            - targets: ['fa:9011']
          basic_auth:
            username: "apikey"
            password: "33052c8a-c283-4e96-9d2a-eb1215c69f8f-not-for-prod"

exporters:
  prometheus:
    endpoint: "0.0.0.0:8889"

service:
  pipelines:
    metrics:
      receivers: [prometheus]
      exporters: [prometheus]
The Collector is configured to pull metrics from the apps it monitors (receivers) and allow other apps (exporters) to pull metrics from it. In this case, the Collector pulls metrics from FusionAuth in the Prometheus format every 15 seconds on http://fa:9011/api/prometheus/metrics using the API key set in the kickstart configuration file. Only one exporter is exposed — metrics in the Prometheus format on port 8889 (OpenTelemetry Collector exposes metrics about itself on port 8888). For more information, see the configuration documentation.
The FusionAuth kickstart configuration files created a superuser API key. For improved security in production, rather create an API key with only the GET permission for the /api/prometheus/metrics endpoint.
The last step is to create the prometheusConfig.yml file with the following content.
global:
  evaluation_interval: 30s
scrape_configs:
  - job_name: otel
    scrape_interval: 15s
    static_configs:
      - targets: ['otel:8889']
This configures Prometheus to pull metrics from the Collector every fifteen seconds.
Run all the containers with docker compose up. You should be able to log in to FusionAuth at http://localhost:9011 with email address admin@example.com and password password, and to Prometheus at http://localhost:9090.
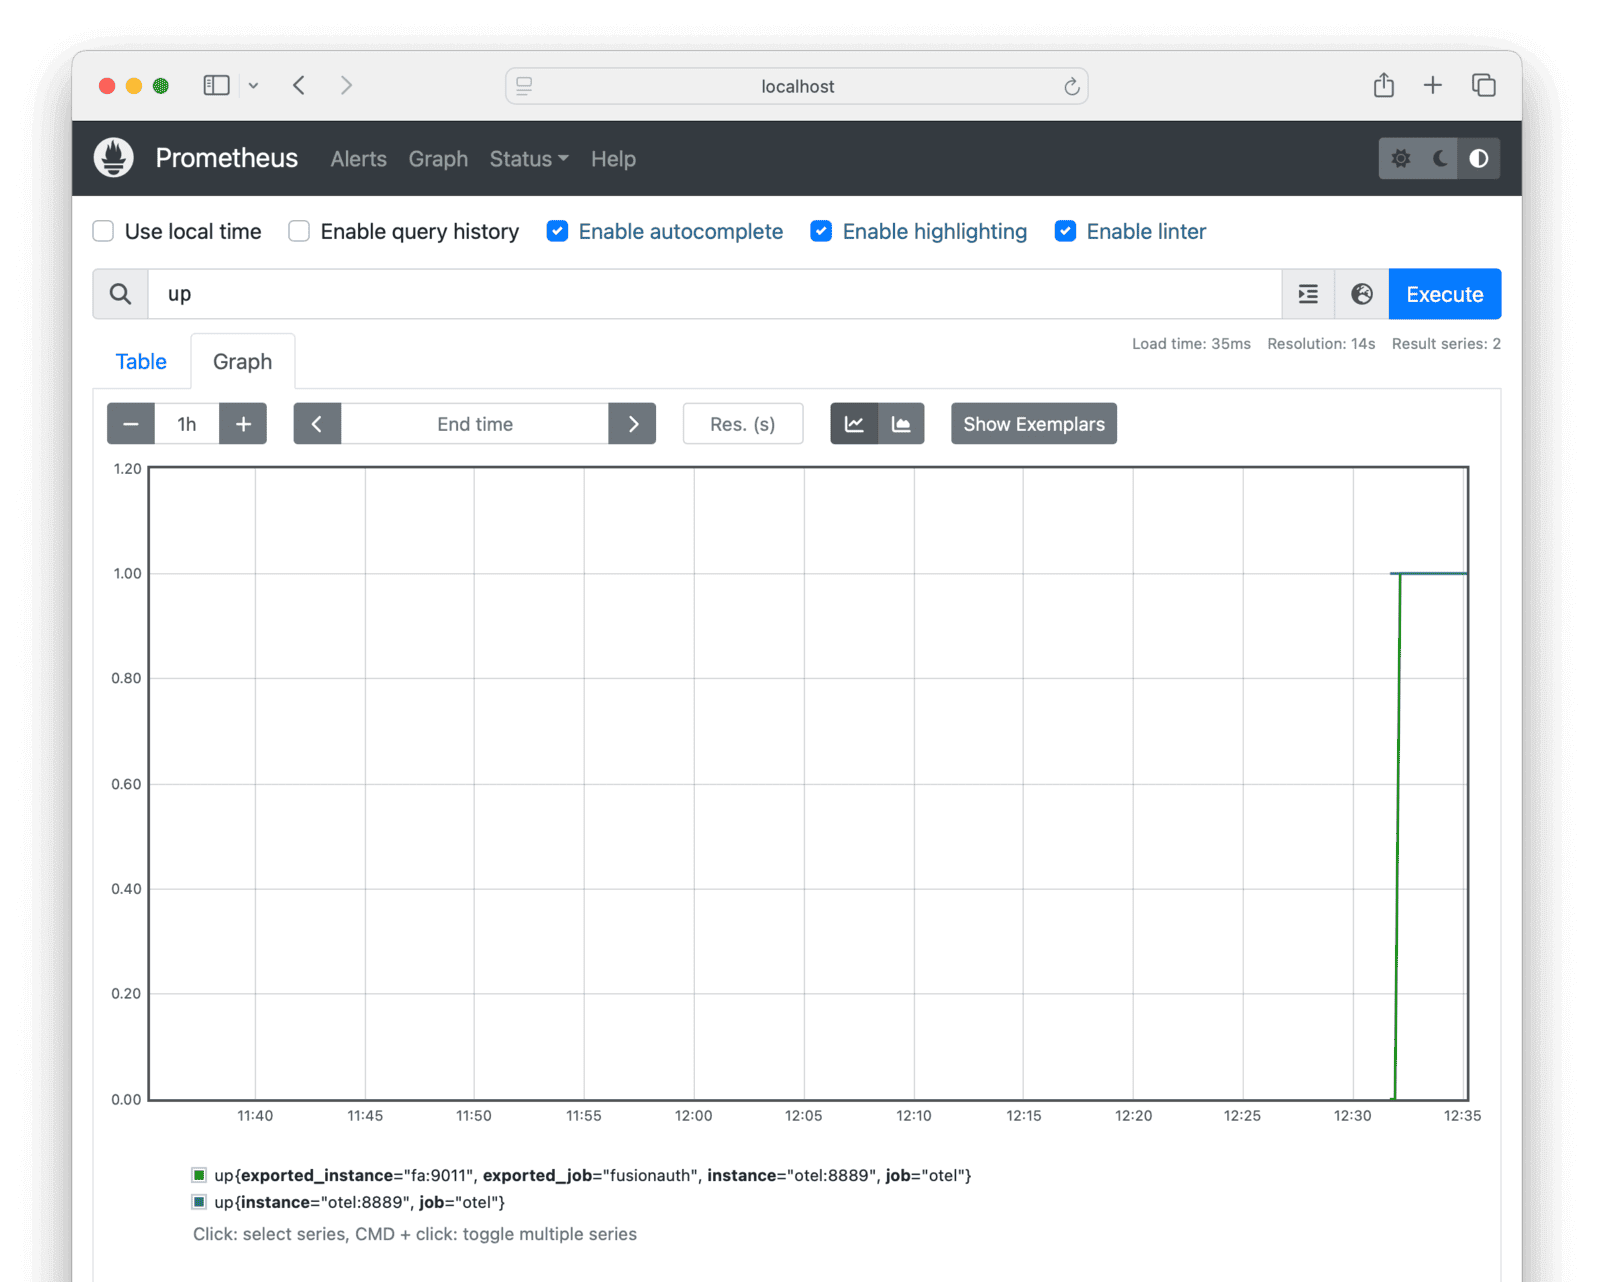
To check that metrics are being pulled correctly, enter up on the Prometheus graph page and see whether any values appear after a minute. If you see nothing, check the Docker log files in the terminal.
Run A Bash Script To Send Custom Metrics To The OpenTelemetry Collector#
FusionAuth provides only some information on its Prometheus endpoint. If you cannot find the information you are looking for in Prometheus, such as user login details, you will need to extract it yourself. In this section, you will learn how to use a custom metrics script to extract information from FusionAuth.
First, update your collectorConfig.yml file to allow the Collector to receive otlp (OpenTelemetry Protocol) metrics on port 4318 (at the top of the YAML), and add OTLP to the list of receivers at the bottom. The updated file content is shown below.
receivers:
  otlp:
    protocols:
      http:
        endpoint: 0.0.0.0:4318
  prometheus:
    config:
      scrape_configs:
        - job_name: 'fusionauth'
          scrape_interval: 15s
          scheme: http
          metrics_path: api/prometheus/metrics
          static_configs:
            - targets: ['fa:9011']
          basic_auth:
            username: "apikey"
            password: "33052c8a-c283-4e96-9d2a-eb1215c69f8f-not-for-prod"

exporters:
  prometheus:
    endpoint: "0.0.0.0:8889"

service:
  pipelines:
    metrics:
      receivers: [prometheus, otlp]
      exporters: [prometheus]
Next, create the custom metric script, the file app.sh, with the content below.
#!/bin/sh

# exit on error
set -e

# SECTION 1. get login records from FusionAuth
otelUrl="http://otel:4318/v1/metrics"
faUrl="http://fa:9011/api/system/login-record/export"
faKey="33052c8a-c283-4e96-9d2a-eb1215c69f8f-not-for-prod"
appId="3c219e58-ed0e-4b18-ad48-f4f92793ae32"

dateFormat=$(echo -n "yyyy-MM-dd'T'HH:mm:ss.SSS" | jq -sRr @uri)
end=$(date +%s)000
start=$(($end - 60000))  # milliseconds
params="applicationId=${appId}&dateTimeSecondsFormat=${dateFormat}&start=${start}&end=${end}"
url="${faUrl}?${params}"
echo "curl -H \"Authorization: ${faKey}\" -o record.zip \"$url\""
curl -H "Authorization: ${faKey}" -o record.zip "$url"
unzip -o record.zip
cat login_records.csv

# SECTION 2. for each record, get the user and unix time in ms
tail -n +2 login_records.csv | while IFS=',' read -r userId time rest; do
  userId=$(echo "$userId" | tr -d ' "' )
  time=$(echo "$time" | tr -d ' "')                      # 2024-06-21T05:14:56.123
  time=$(echo "$time" | tr 'T' ' ')                      # 2024-06-21 05:14:56.123
  sec="$(date -d "$(echo $time | cut -d '.' -f 1)" +%s)" # 1718946896
  ms="$(echo $time | cut -d '.' -f 2)"                   # 123

  # make OTLP JSON payload
   json_payload=$(cat <<EOF
{
  "resource_metrics": [{
    "resource": {
      "attributes": [
        {"key": "service.name", "value": {"stringValue": "fusionauth"}},
        {"key": "host", "value": {"stringValue": "fusionauth"}}
      ]
    },
    "scope_metrics": [{
      "metrics": [{
        "name": "login_event",
        "gauge": {
          "dataPoints": [{
            "asInt": 1,
            "timeUnixNano": "${sec}${ms}000000",
            "attributes": [ {"key": "user_id", "value": {"stringValue": "$userId"}} ]
          }]
        }
      }]
    }]
  }]
}
EOF
)

  # send data to Collector
  curl -X POST -H "Content-Type: application/json" -d "$json_payload" $otelUrl
done
All of SECTION 1 above is used to download a file of user login records from FusionAuth. The URL, api/system/login-record/export, is called with a timespan from one minute ago until now. The records are downloaded as a ZIP file and extracted.
SECTION 2 opens the unzipped CSV file with tail, loops through it with while, converts every line to a JSON object of the time the user logged in and their user Id, and still in the loop, uses curl to post the JSON data to the OpenTelemetry Collector on the otelUrl.
Build this script into an image by creating a file called Dockerfile with the content below. The last line runs the script every sixty seconds.
FROM --platform=linux/amd64 alpine:3.19
RUN apk add --no-cache curl nano jq bash docker-cli
COPY app.sh /app.sh
RUN chmod +x /app.sh
CMD watch -t -n 60 /app.sh
Build the image with the command below.
docker build --platform linux/amd64 -t scriptimage .Use the new image in your docker-compose.yml configuration by adding the service below.
  script:
    image: scriptimage
    container_name: faScript
    platform: linux/amd64
    depends_on:
      - fa
      - otel
    networks:
      - db_net
Run everything with docker compose up, or if the other containers are already running, with docker compose up script. Check the terminal to confirm there are no errors in the Docker logs. In your browser, log out of FusionAuth and then log in again, so the custom script will retrieve a login metric for the last sixty seconds.
If the OpenTelemetry Collector and custom script worked correctly, when you browse to Prometheus you should now be able to see the login_event metric in the graph.
Since the metrics are separated by user Id, there are too many lines on the screen to be useful for monitoring. Use Prometheus queries like the following three to aggregate the metrics over time and group them across users.
count_over_time(login_event[5h])

sum(count_over_time(login_event{exported_job="fusionauth", instance="otel:8889", job="otel"}[5h]))

sum without(user_id) (count_over_time(login_event{exported_job="fusionauth", instance="otel:8889", job="otel"}[5h])) /5
Alternatively, you can remove the attributes property in the JSON section of app.sh, so that the login_event sent to the Collector has no user information.
If you cannot see the custom metrics arriving in Prometheus, it’s faster to debug the script locally on your machine without Docker. To do so, you need to make the script executable by running chmod +x app.sh. You also have to change the two container URLs to localhost at the top of the script:
otelUrl="http://otel:4318→otelUrl="http://localhost:4318faUrl="http://fa:9011→faUrl="http://localhost:9011
Now you can run the script with ./app.sh and add echo statements to debug each section.
Which Custom Metrics To Monitor?#
You can add any other metrics you want to this bash script.
FusionAuth has too many metrics to discuss in this article. You will need to decide which are important for you to monitor by reading the documentation.
In addition to the metrics available through the various FusionAuth APIs, you can create your own metrics using any events that trigger webhooks. A webhook can call another Docker container (created by you) that listens for incoming events and forwards them to the Collector.
A useful metric to start with is login counts. If this number drops from the average, it’s a good sign something might be wrong with your system.
Next Steps#
OpenTelemetry is not a standalone tool. Read the FusionAuth guides to Prometheus and Elastic to choose a complete system that provides a dashboard with alerts you can use in conjunction with OpenTelemetry.