Monitor With Elastic
Introduction#
Elastic is a company known for managing the ELK stack: Elasticsearch, Logstash, and Kibana. These products allow you to import (ingest) data, including observability data like logs and server metrics, organize it, and monitor it.
This guide explains how to connect FusionAuth to Elastic in various ways, identifies FusionAuth metrics that are useful in Elastic, and shows how to create a simple dashboard to show them.
Before continuing with this guide, please go through the FusionAuth guide to monitoring to get an overview of the available metrics and choose the ones relevant to your needs.
Refer to the Elastic documentation to learn more about the Elastic Observability platform, and compare Elastic subscriptions on the pricing page. The Standard (lowest) pricing tier includes sufficient observability features, including handling logs and metrics.
Elastic can import and visualize different types of data, including server performance, application (FusionAuth) performance, and logs.
As well as monitoring FusionAuth with Elastic, you can use Elastic to monitor your custom application by following steps similar to the ones in this guide.
Cloud-Hosted Or Self-Hosted?#
Before 2021, Elastic products were open-source software. In 2021, Elastic changed their licenses to Elastic License 2.0 to prevent cloud hosts (AWS, Google, Azure) from freely selling managed Elastic services that compete with Elastic Cloud.
While not officially open source, the Elastic License 2.0 still allows free and open (gratis and libre) use of most Elastic products, as long as you are not selling them as your own service. So you can host the Elastic stack on your own server instead of buying Elastic Cloud, but you will still need to pay Elastic to use certain premium features, like AI.
This guide assumes you are using the paid Elastic Cloud for monitoring. If you are self-hosting Elastic, you should still be able to follow the guide, but you will need to change connections that point to Elastic Cloud to point to your own server. To install Elastic yourself in Docker, follow the first half of this guide until you reach the MetricBeat section.
In the Elastic documentation (for example, the getting started guide), you may read that "you need an Elastic Stack deployment". Note that this does not mean you need to deploy the entire ELK stack locally alongside your application or FusionAuth instance. It simply means that you need to have the Elastic Stack installed somewhere, which will likely be on their Elastic Cloud.
Create An Elastic Account#
First, register for an Elastic account:
- Register for a trial at https://cloud.elastic.co/registration.
- Verify your email address using the link in the email Elastic sends you.
- Enter your details on the registration page and create a new deployment called
fa. Note that your two-week free trial starts when you create the deployment.
How To Send Data To Elastic Cloud#
There are many ways to use Elastic. This guide will help you choose the simplest combination that suits the needs of your system architecture.
Elastic Agent sends data from your server to Elastic Cloud for processing and monitoring. To use Elastic Cloud, you must first install Elastic Agent on your server.
The options for sending data to Elastic Cloud include:
- Install Elastic Agent in the same Docker container as FusionAuth.
- Install Elastic Agent in a separate container and give it access to the private Docker management data for other containers.
- Install a local OpenTelemetry agent to send data to Elastic instead of using Elastic Agent.
- Call the Elastic API directly from a local service instead of using Elastic Agent.
Monitor FusionAuth With Elastic In The Same Container#
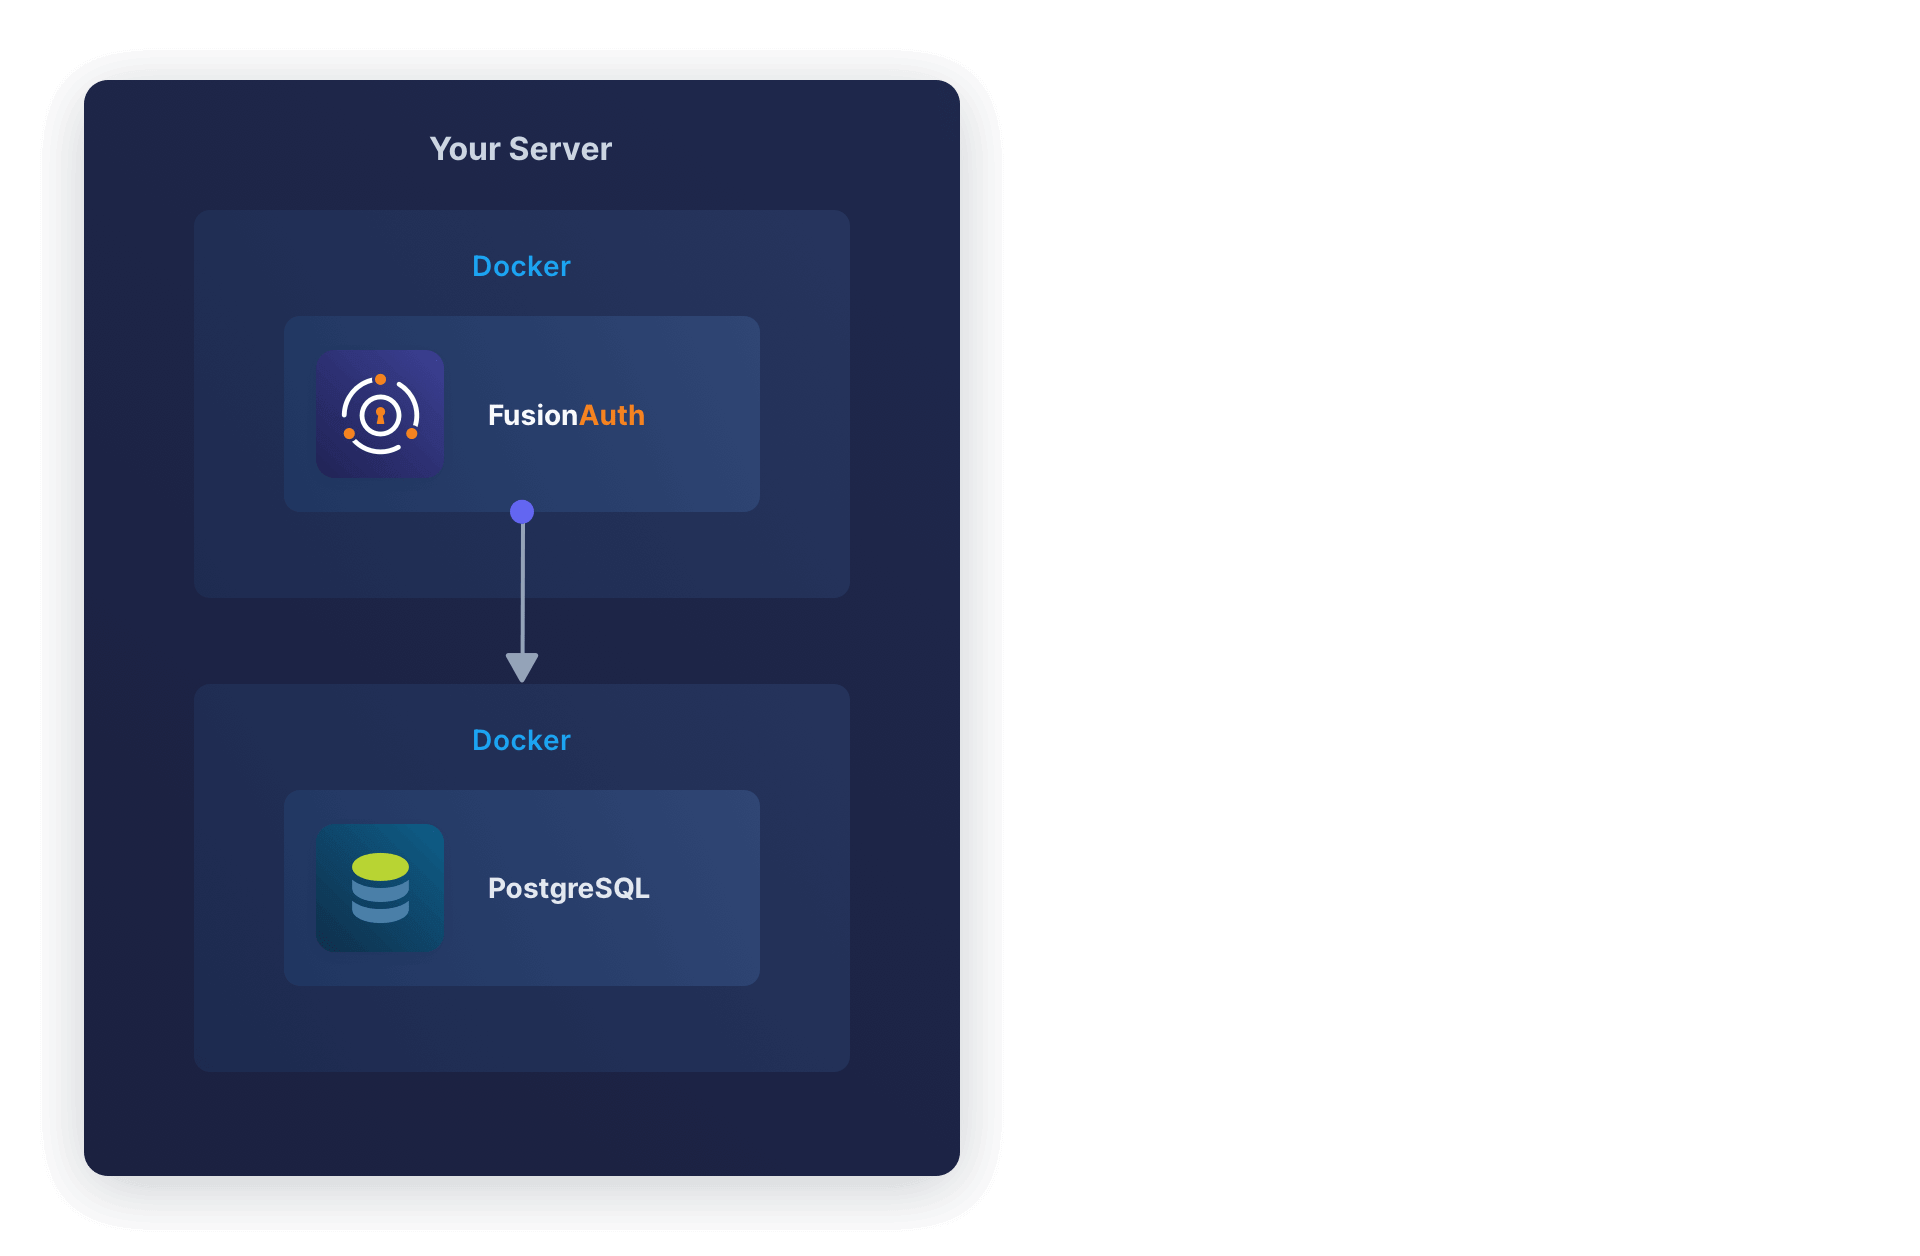
Running FusionAuth and PostgreSQL in Docker usually looks like the diagram below (you might also run OpenSearch in another Docker container).
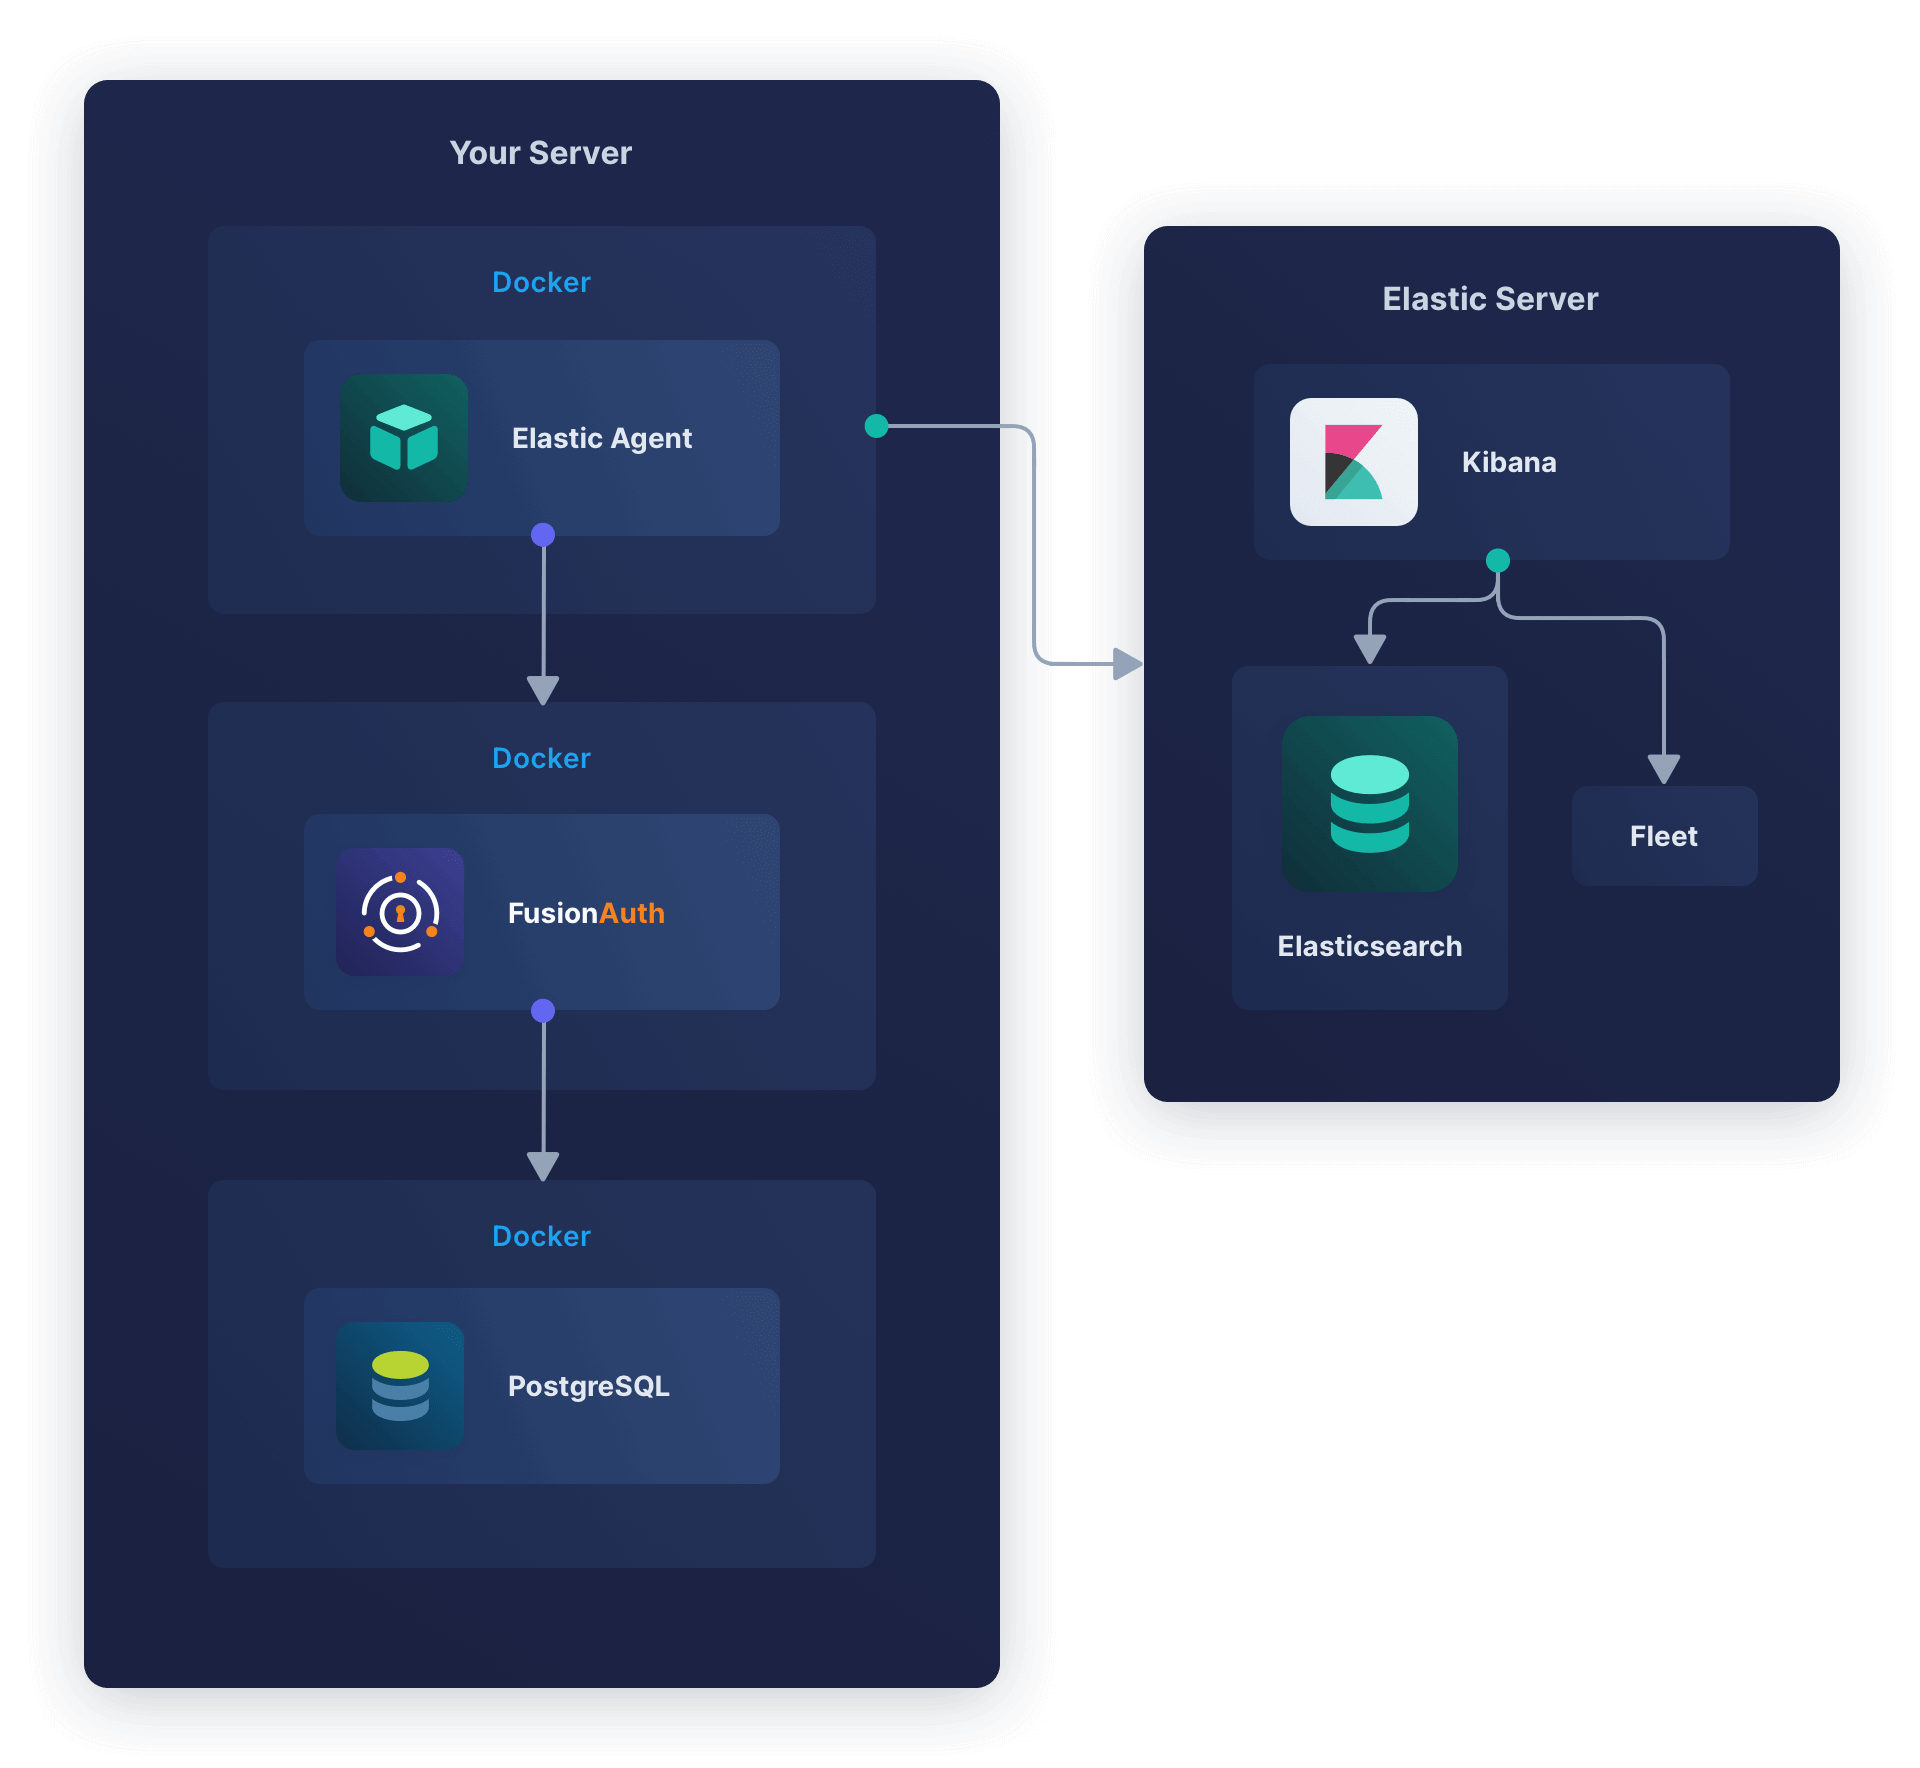
In this section, you will install Elastic Agent in the same container as FusionAuth. The aim is to have a design like the diagram below.
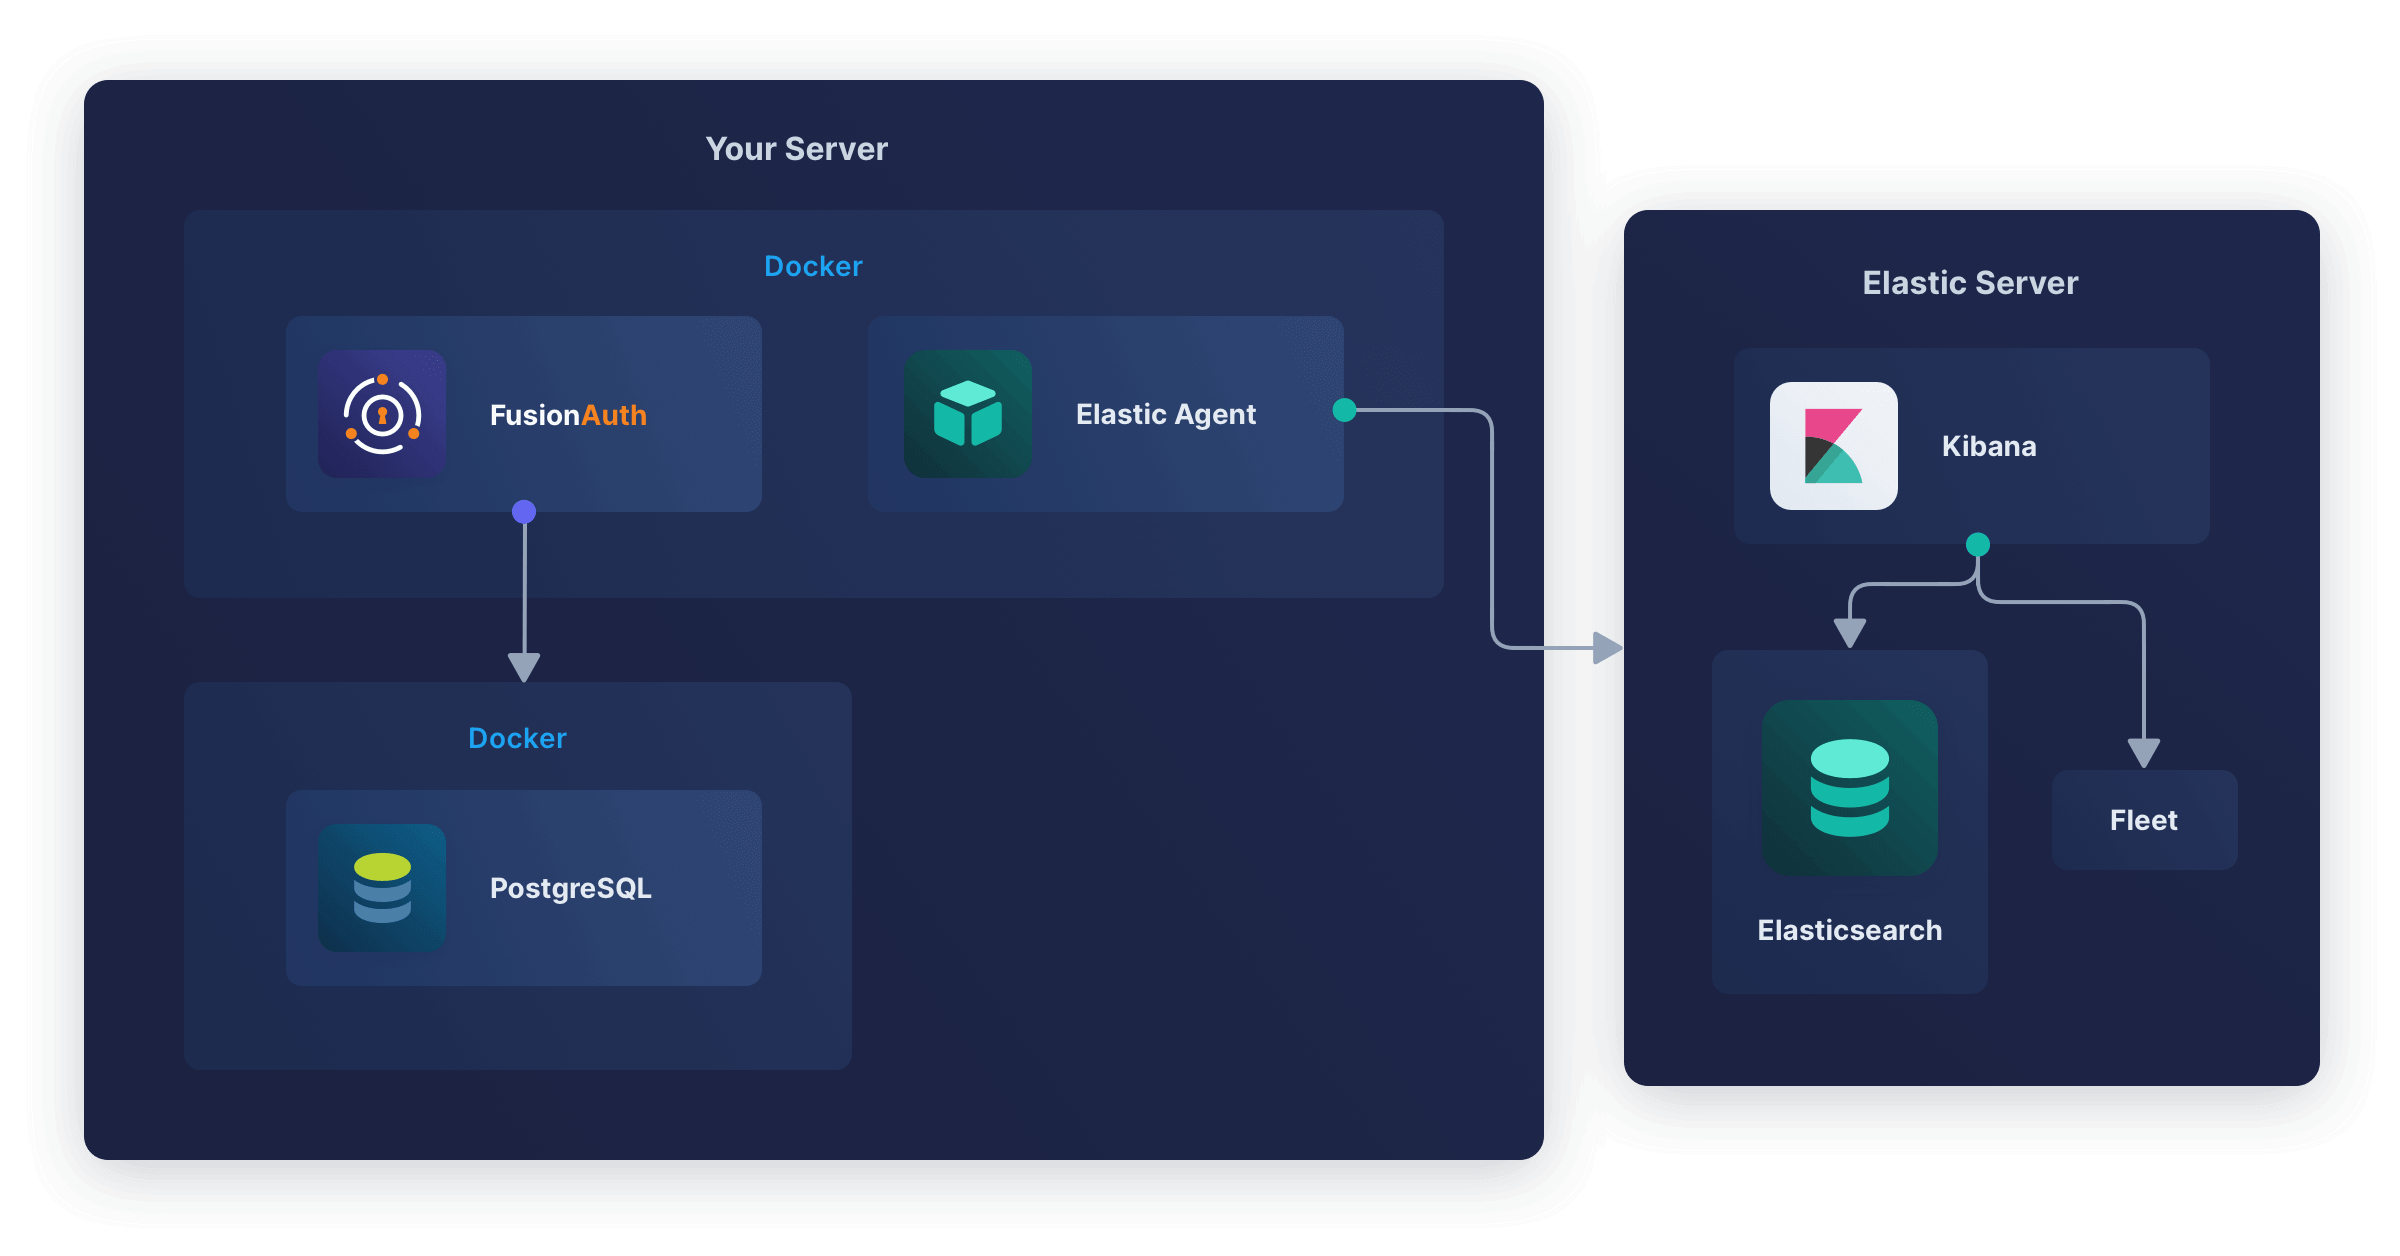
FusionAuth and PostgreSQL are unchanged. Elastic Agent in the FusionAuth container monitors the container (not the FusionAuth app) and uploads the data to Elasticsearch, where it is indexed and saved.
Kibana is a web interface that provides dashboards of the health of the Elastic Agent's container. Note that Elastic Agent is not yet monitoring FusionAuth in this design, but if the container dies or suffers CPU or RAM overuse, that will show in the Kibana dashboard.
Fleet is the web app that tracks all Elastic Agents on all servers. It allows you to set Agent Policies that tell the agents remotely what data they should and shouldn't upload. You can also use Fleet to delete or edit existing agents.
This design is useful when you don't have full control over the Docker environment, as you may not have on some cloud hosts. However, the design violates the principle of one process per Docker container. This means the Elastic Agent process can die while the container and FusionAuth process keep running, which will cause confusion when viewing the dashboard.
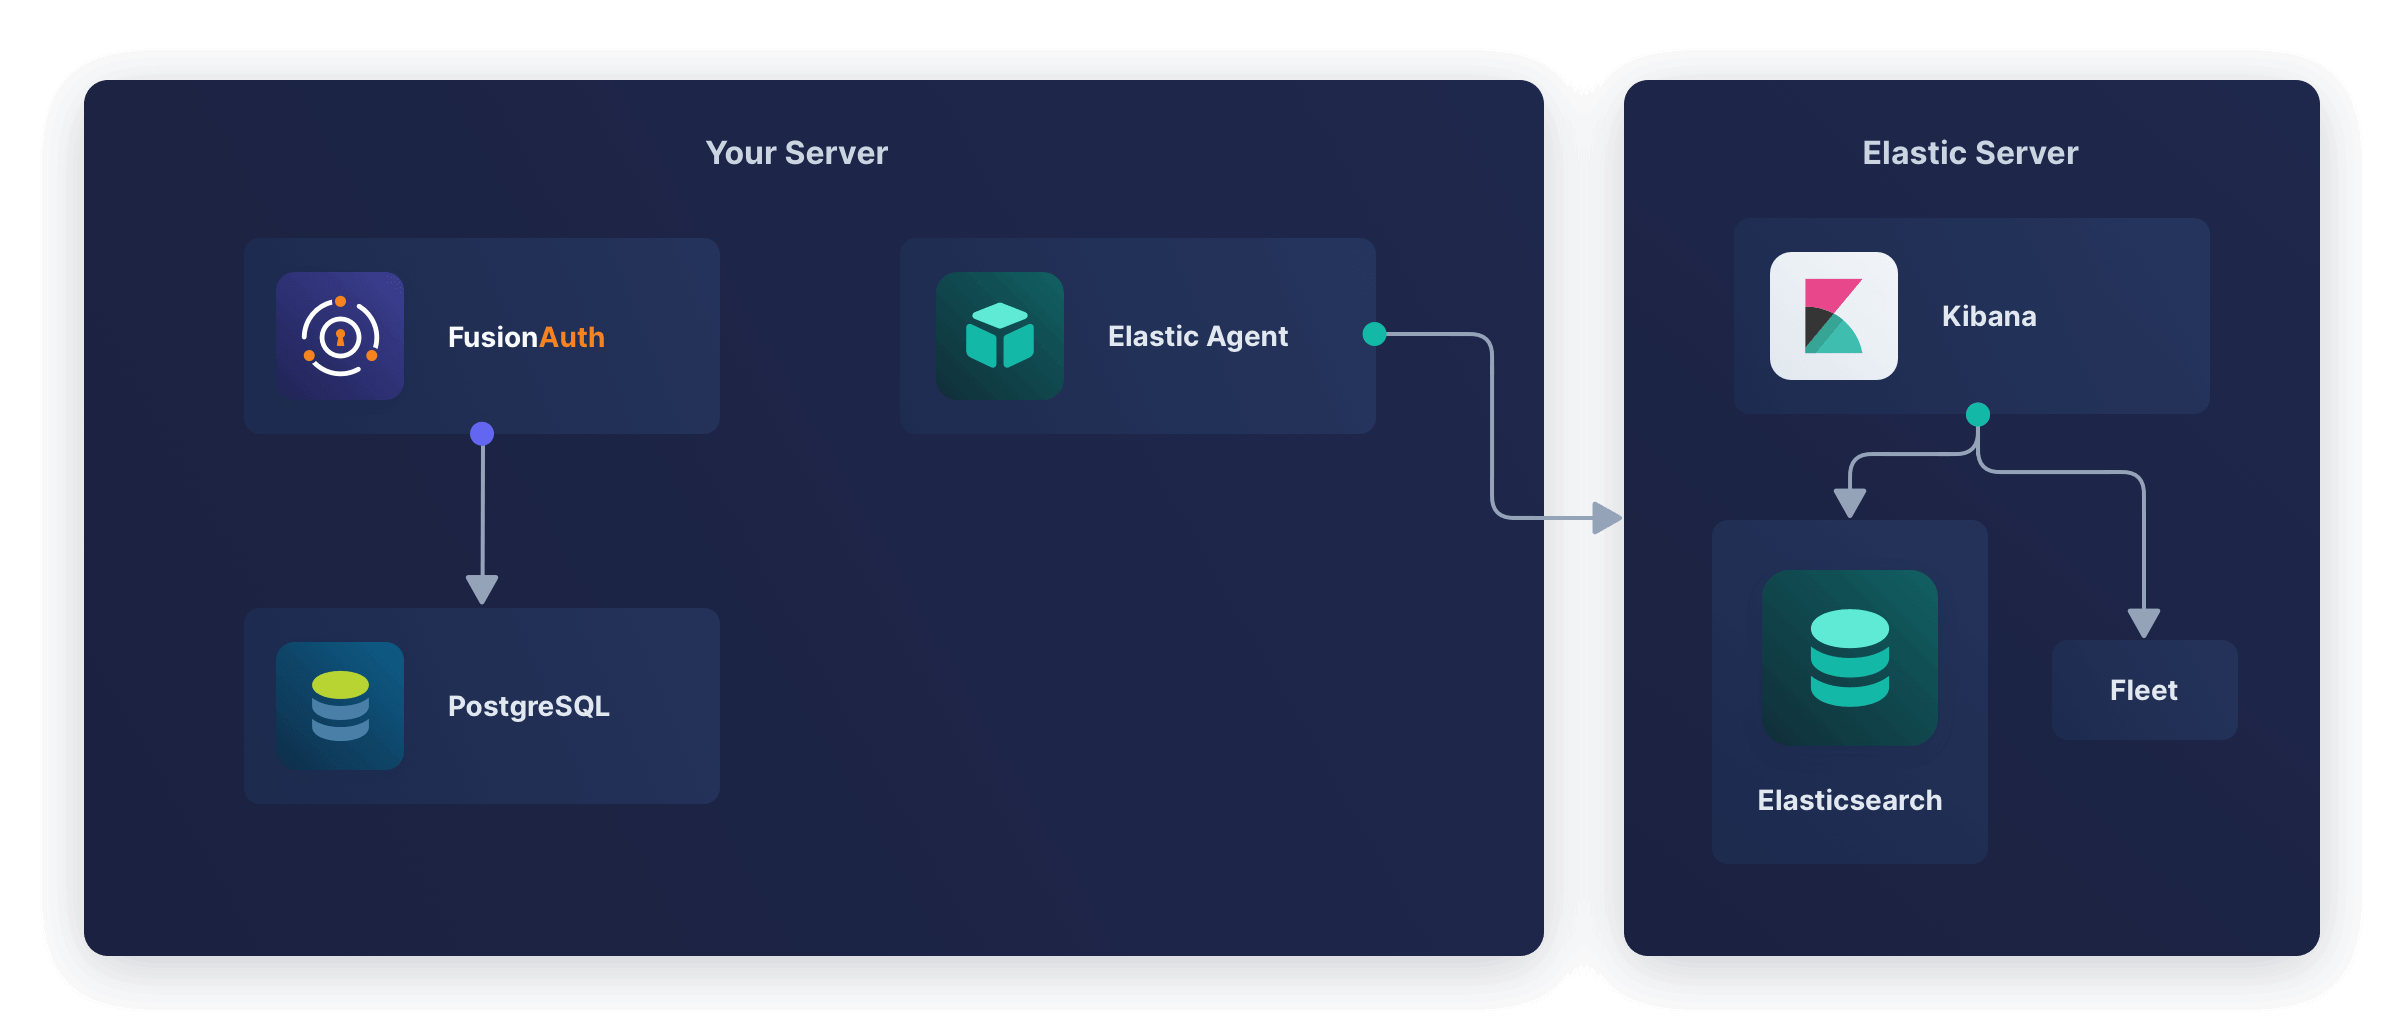
Running Elastic Agent on the same server as FusionAuth is also useful when you aren't using Docker (that is, running FusionAuth directly on your server). In this case, your system will look like the diagram below.
Here's how to implement this design.
Navigate to the home page of your Elastic Cloud web interface and do the following:
-
At the bottom of the sidebar, click Management -> Fleet .
-
Select the Agent policies tab, then click Create agent policy.
-
Name the policy
efa. Review the advanced options if you like, but leave their defaults unchanged. -
Click Create agent policy.
-
Back on the agent policy list page, click the name of your new policy,
efa. -
Under the Integrations tab, the "System" integration should show. Click the name of the integration to open a page to edit it. If you don't see the system integration, click Add integration to the right, search for
System, and add it.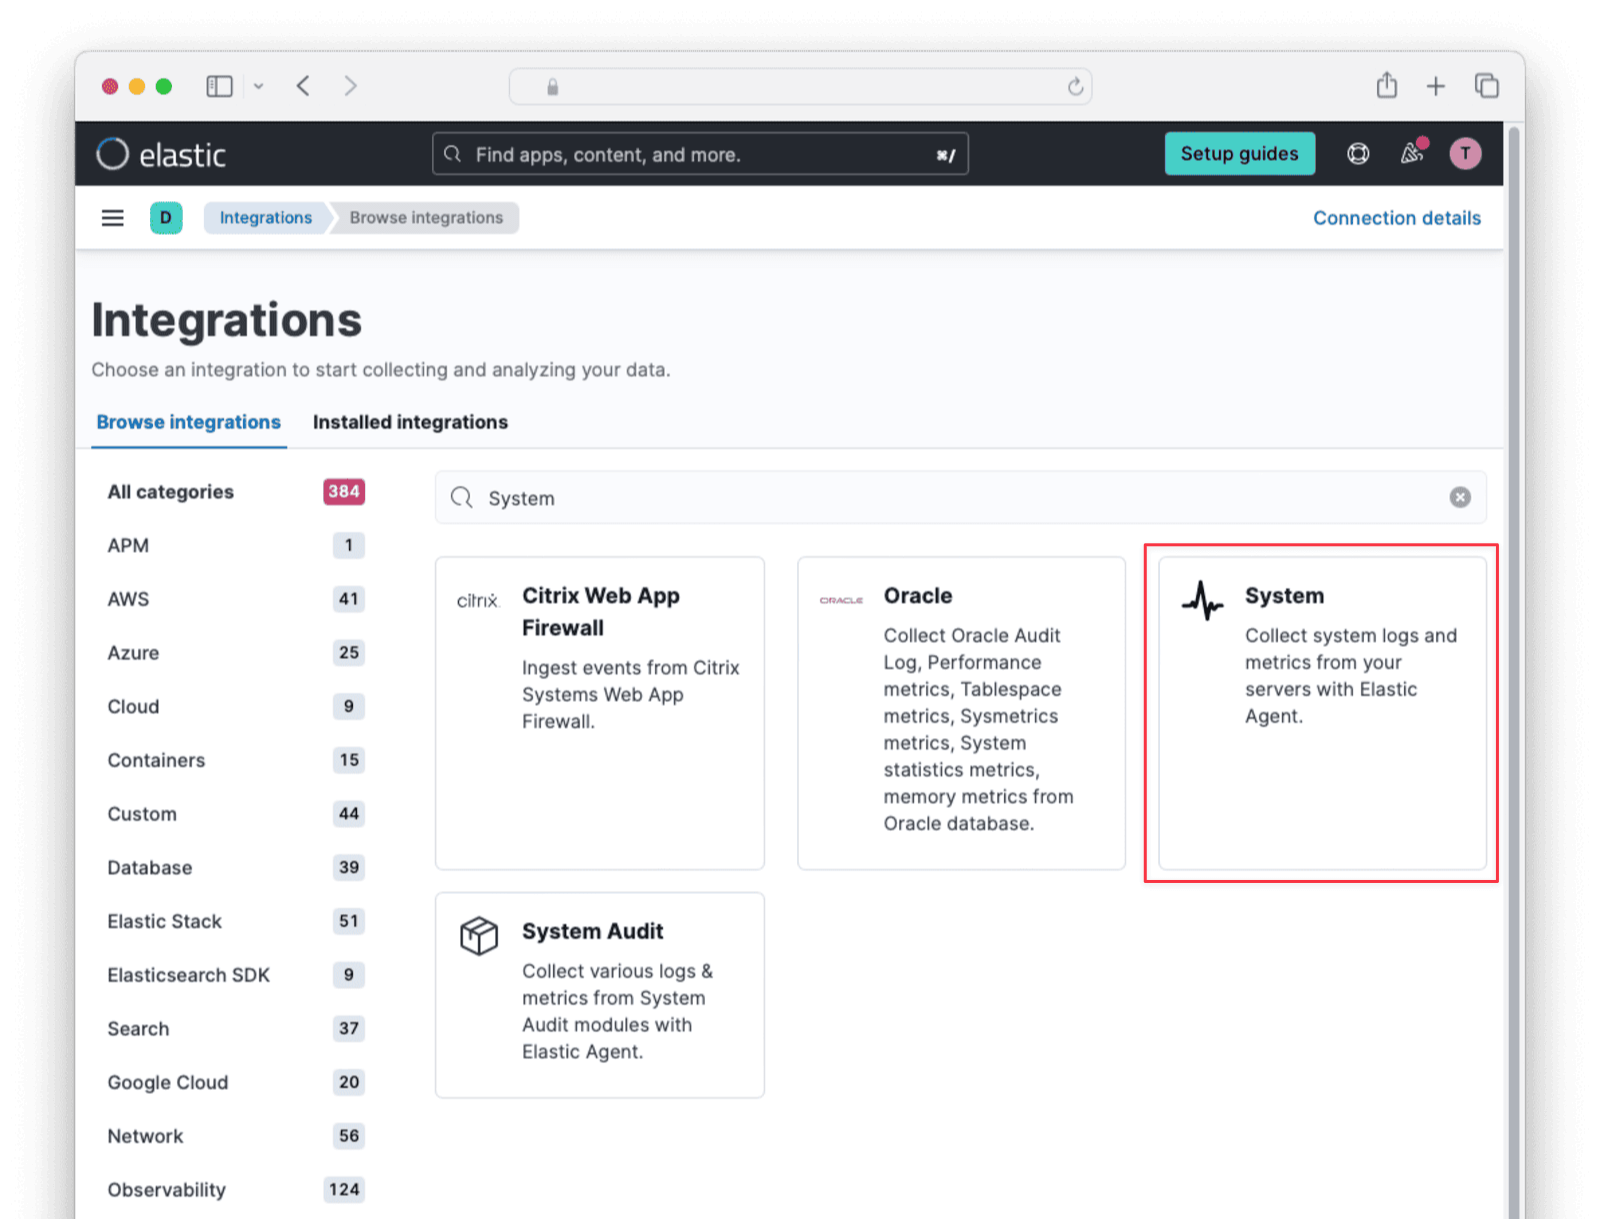
-
Disable Collect events from the Windows event log and leave the system collection and metric collection toggles enabled. Since your Docker instance runs Ubuntu there is no need for Windows events.
-
Click on Save integration at the bottom right.
-
Return to the Agents tab of the Fleet page and click Add Agent.
-
Choose your newly created agent policy in the dropdown that appears for step 1.
-
Copy the text to install the "Linux Tar" version of the agent in step 3, which will be similar to the commands below, but with different parameters.
curl -L -O https://artifacts.elastic.co/downloads/beats/elastic-agent/elastic-agent-8.14.2-linux-x86_64.tar.gz tar xzvf elastic-agent-8.14.2-linux-x86_64.tar.gz cd elastic-agent-8.14.2-linux-x86_64 sudo ./elastic-agent install --url=https://9025e4274.fleet.us-central1.gcp.cloud.es.io:443 --enrollment-token=a2lB5aA1dUagaTk5FUsE743dw== -
From the last line of the command sequence, note the subdomain of the URL, which is your unique Elastic Cloud home, and the enrollment token, which is your secret key to use Elastic. Keep the token secure and safe, and never commit it to GitHub where it can be publicly exposed.
Now leave the Elastic site and complete the following steps in a terminal on your computer:
- Install Docker if you don't have it on your machine.
- Save the Dockerfile from the FusionAuth containers repository to your computer.
- Rename the file to
elastic.dockerfile. - Edit the file and insert the following lines above the comment "###### Start FusionAuth App".
###### New for Elastic ################################# RUN mkdir -p /var/lib/apt/lists/partial \ && chmod 755 /var/lib/apt/lists/partial \ && apt update \ && apt install -y ca-certificates \ && apt install nano sudo -y \ && echo "fusionauth ALL=(ALL) NOPASSWD: ALL" > /etc/sudoers.d/fusionauth \ && curl -L -O https://artifacts.elastic.co/downloads/beats/elastic-agent/elastic-agent-8.14.3-linux-x86_64.tar.gz \ && mkdir -p /elastic \ && tar xzvf elastic-agent-8.14.3-linux-x86_64.tar.gz --strip-components=1 -C /elastic \ && yes | /elastic/elastic-agent install --url=https://9059ac5.fleet.us-central1.gcp.cloud.es.io:443 --enrollment-token=lBSVldsaUlMRnoyZGh2Zw== - Change the URL and token in the last line to match your values from the Elastic website. Update the version number of the agent if yours is newer.
- Replace the last line of the file,
CMD ["/usr/local/fusionauth/fusionauth-app/bin/start.sh"]withCMD sudo /opt/Elastic/Agent/elastic-agent run & /usr/local/fusionauth/fusionauth-app/bin/start.sh. Now both the Elastic Agent and FusionAuth will run when the container starts. The Agent has to run as root as it reads data sources that only a superuser can access. Even though the Dockerfile unzips the Agent to/agent/, the agent installs to/opt/Elastic/Agent/. - Build the image with the command below.
docker build --platform linux/amd64 -t efaimage -f elastic.dockerfile . - Use the modified
docker-compose.ymlfile from the FusionAuth five-minute guide to have the content below. It uses theefaimageimage you just built for FusionAuth.services: db: image: postgres:latest container_name: fa_db ports: - "5432:5432" environment: PGDATA: /var/lib/postgresql/data/pgdata POSTGRES_USER: ${POSTGRES_USER} POSTGRES_PASSWORD: ${POSTGRES_PASSWORD} healthcheck: test: [ "CMD-SHELL", "pg_isready -U postgres" ] interval: 5s timeout: 5s retries: 5 networks: - db_net volumes: - db_data:/var/lib/postgresql/data fa: image: efaimage container_name: efa depends_on: db: condition: service_healthy environment: DATABASE_URL: jdbc:postgresql://db:5432/fusionauth DATABASE_ROOT_USERNAME: ${POSTGRES_USER} DATABASE_ROOT_PASSWORD: ${POSTGRES_PASSWORD} DATABASE_USERNAME: ${DATABASE_USERNAME} DATABASE_PASSWORD: ${DATABASE_PASSWORD} FUSIONAUTH_APP_MEMORY: ${FUSIONAUTH_APP_MEMORY} FUSIONAUTH_APP_RUNTIME_MODE: ${FUSIONAUTH_APP_RUNTIME_MODE} FUSIONAUTH_APP_INSTALLATION_SOURCE: site/monitor-elastic FUSIONAUTH_APP_URL: http://fusionauth:9011 SEARCH_TYPE: database networks: - db_net ports: - 9011:9011 volumes: - fusionauth_config:/usr/local/fusionauth/config extra_hosts: - "host.docker.internal:host-gateway" networks: db_net: driver: bridge volumes: db_data: fusionauth_config: - Create a
.envfile with the default content below.DATABASE_USERNAME=fusionauth DATABASE_PASSWORD=hkaLBM3RVnyYeYeqE3WI1w2e4Avpy0Wd5O3s3 FUSIONAUTH_APP_MEMORY=512M FUSIONAUTH_APP_RUNTIME_MODE=development OPENSEARCH_JAVA_OPTS="-Xms512m -Xmx512m" POSTGRES_USER=postgres POSTGRES_PASSWORD=postgres - Start FusionAuth with
docker compose up.
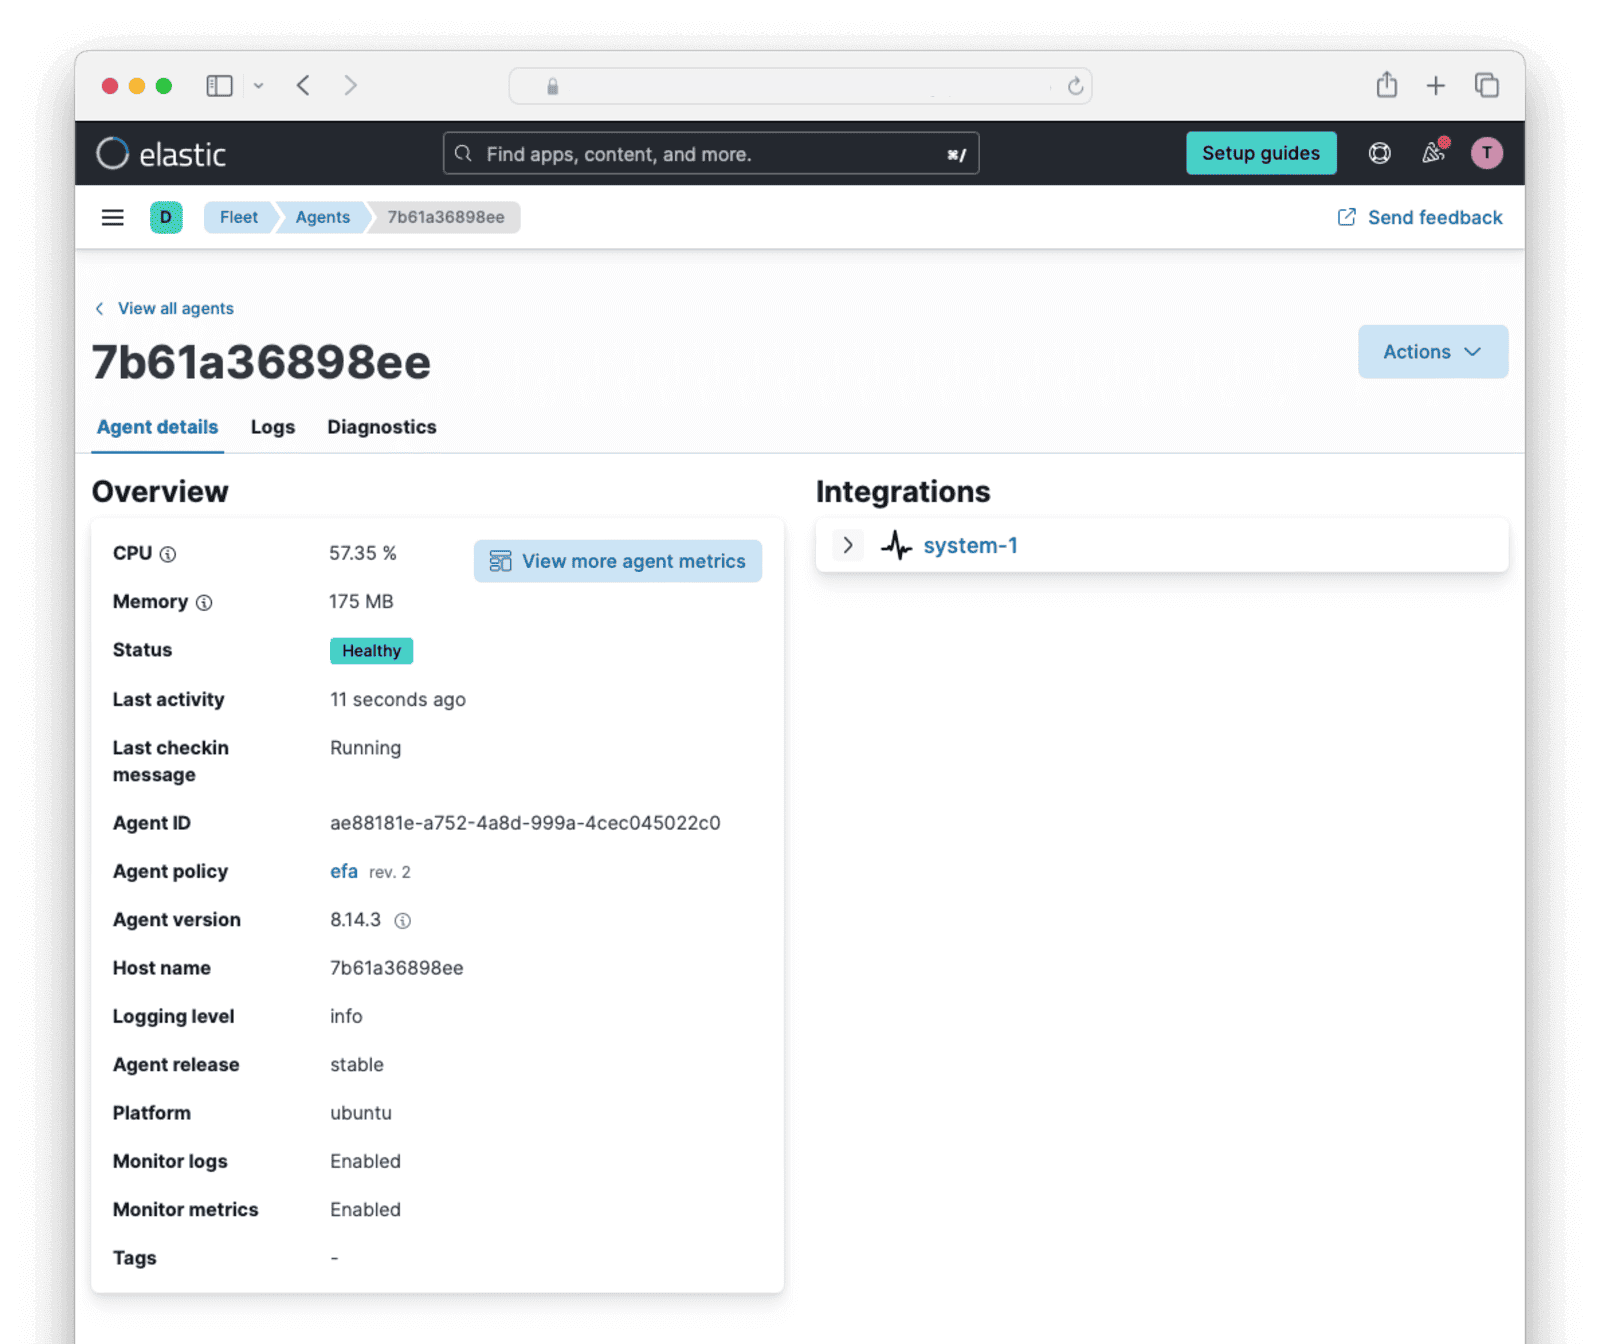
Return to the Elastic web interface, and you should see the message "Agent enrollment confirmed".
You should see the agent in the Fleet dashboard with the status showing Healthy.
In the sidebar, browse to Analytics -> Dashboards . Search for and display Host overview.
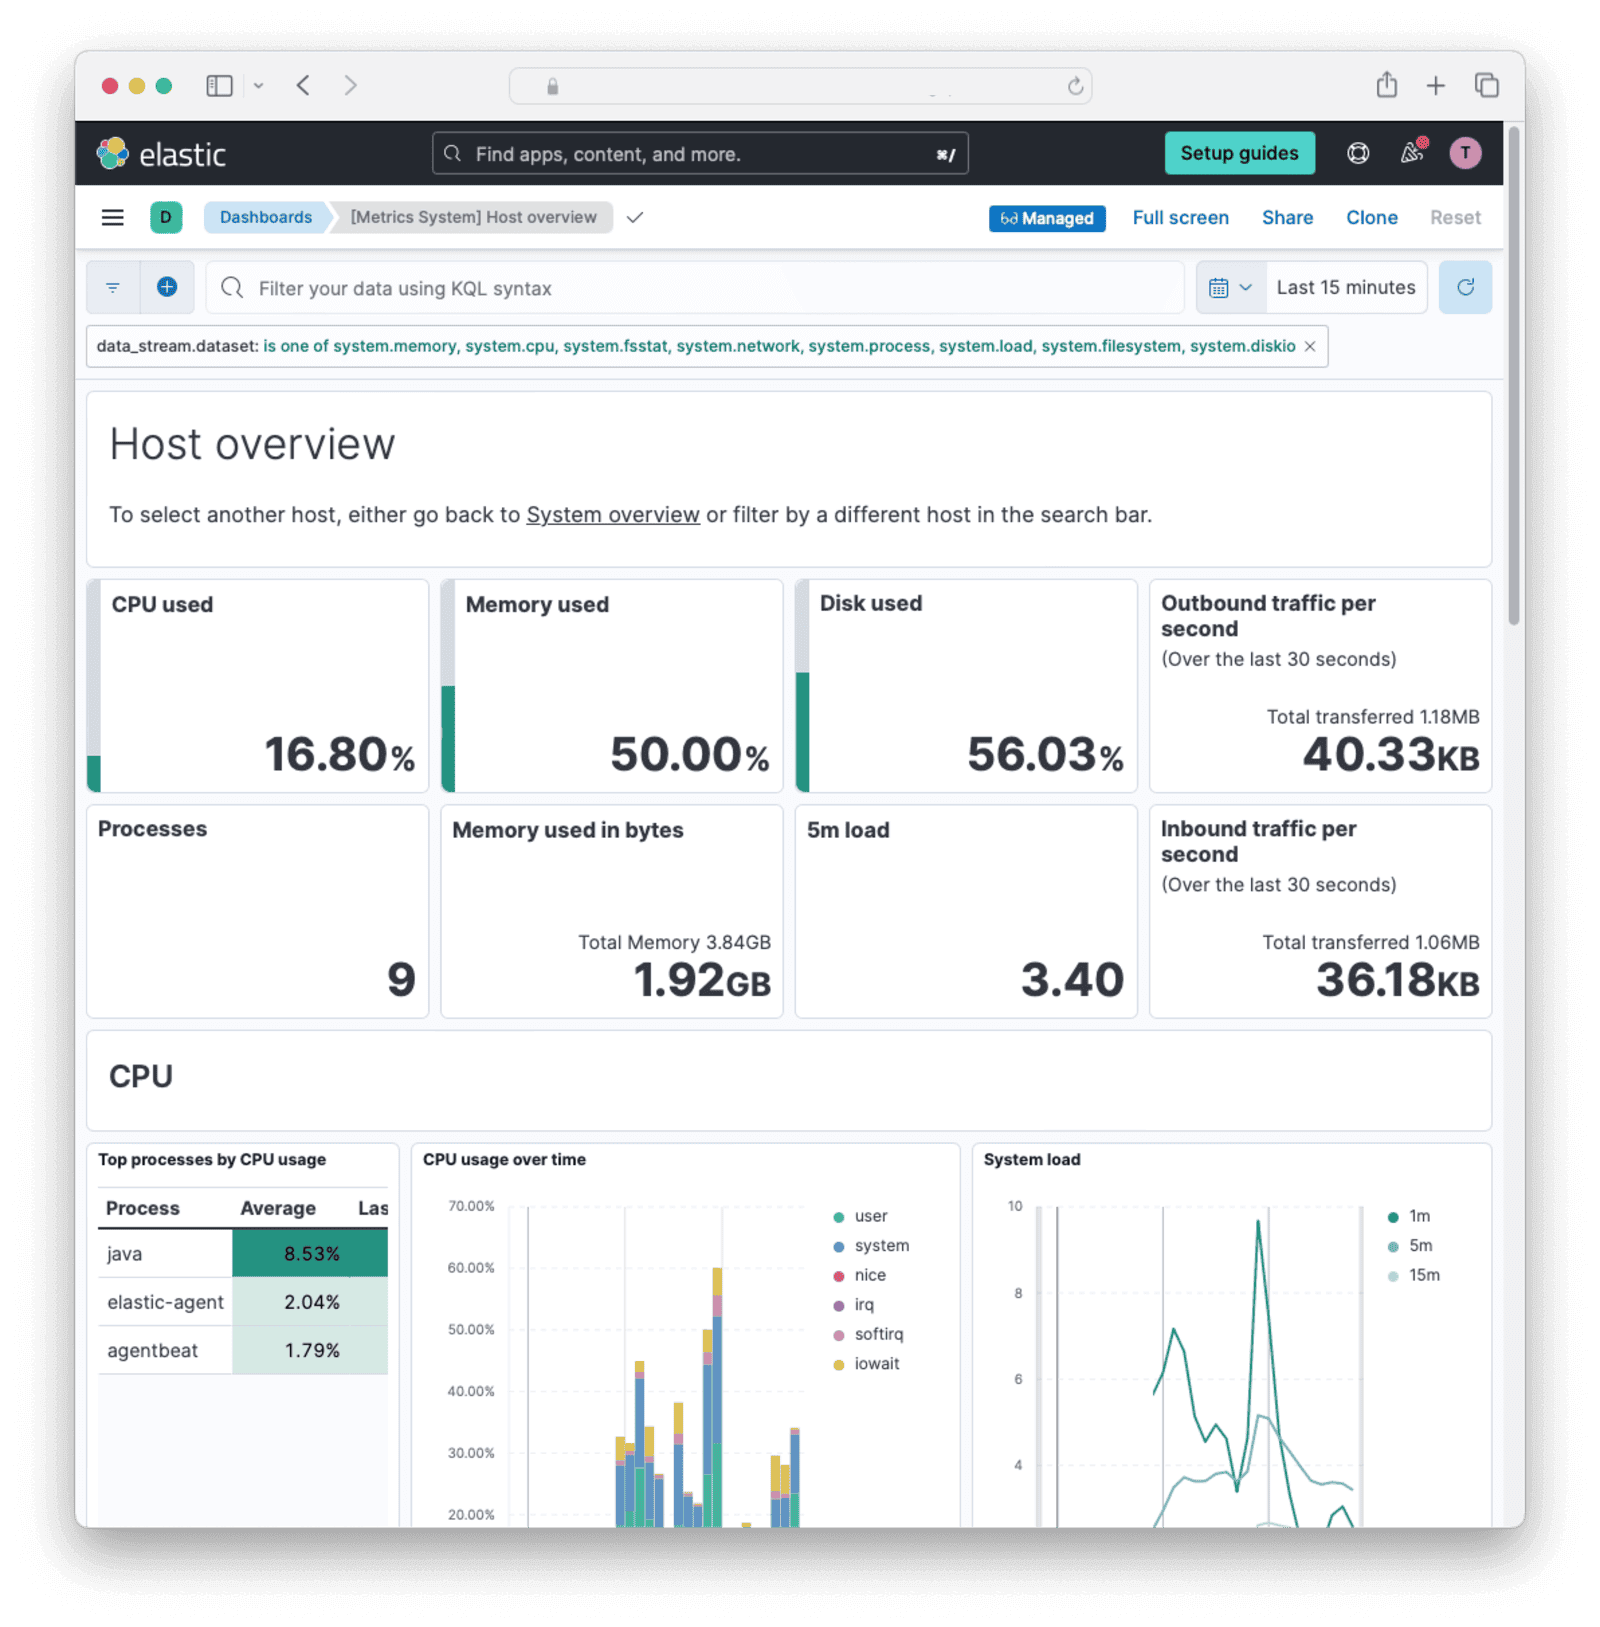
The monitoring agent for your FusionAuth machine is now installed and you can now monitor it online.
How To Debug The Container#
If you get errors when running FusionAuth, or the Agent does not appear in Fleet, you will need to open a terminal in the container to find the problem.
To stop FusionAuth and the Agent starting so you can test manually, change the last line of the Dockerfile to the line below.
CMD tail -f /dev/nullRebuild the Dockerfile after changes.
docker rm fa; docker rm efa; docker rmi efaimage; docker build --platform linux/amd64 -t efaimage -f elastic.dockerfile .Run the container and enter it as root.
docker run -it --user root --name efa efaimage bashStart the agent with /opt/Elastic/Agent/elastic-agent run and use cat /var/log/elastic-agent.err to look for errors. If you see the agent trying to connect to 127.0.0.1:9200, it is not because the URL is configured incorrectly. The 127 address is just a fallback when the agent cannot connect to the server, usually due to it not running as root.
Monitor FusionAuth With Elastic In Another Container#
Running Elastic Agent and FusionAuth in the same container requires altering the FusionAuth Dockerfile, which means you have to edit the file and rebuild the image every time you want to use a new version of FusionAuth.
Running Elastic Agent in a separate container will avoid this problem, but you need to have full control over the machine running Docker to give Elastic Agent access to restricted Docker data (the Docker socket). This may not be possible on some cloud hosts.
Running Elastic Agent in a separate container to FusionAuth is shown in the diagram below.
Below are the instructions to implement this design. They follow from the work you did in the previous section.
-
Browse to the Elastic web interface.
-
Click Add integrations on the sidebar. Search for and add Docker.
-
Give it the name
fadocker. -
At the bottom of the page, name the new policy
fadockerpolicy. -
Click Save and continue.
-
Click Add Elastic Agent to your hosts. You need the URL and token given on the page that shows, but you won't need the installation commands. Elastic already provides a prebuilt Docker image you can use instead.
-
Change the Docker compose file you used in the previous section to replace the custom
efaimageimage with the normal FusionAuth image.fa: image: fusionauth/fusionauth-app:latestNote that you could continue using the
efaimageimage if you wanted to. Elastic allows you to run as many agents as you want, and will collect data from all of them. -
Add a new service to the compose file for the Elastic Agent image. Replace your URL and enrollment token in the markup below with the values from the Elastic web page.
faelastic: image: elastic/elastic-agent:8.14.3 container_name: faelastic user: root networks: - db_net environment: - FLEET_ENROLL=1 - FLEET_ENROLLMENT_TOKEN=YTRBMBa1RvUQ== - FLEET_URL=https://905ec5.fleet.us-central1.gcp.cloud.es.io:443 volumes: - /var/run/docker.sock:/var/run/docker.sock:ro # `ro` makes the folder readonly in the container to protect your real machine - /var/lib/docker/containers:/var/lib/docker/containers:ro/var/run/docker.sockallows Elastic Agent to view Docker metrics about other containers. It will work on Linux and macOS hosts, but might not work on Windows. If you encounter socket problems on Windows, please read this article and try prefixing your local socket path with an extra slash./var/lib/docker/containersallows Elastic Agent to read the logs of other containers.
-
Run the Elastic Agent container first, so that it will see some log information from other containers when they start. Run
docker compose up faelastic. -
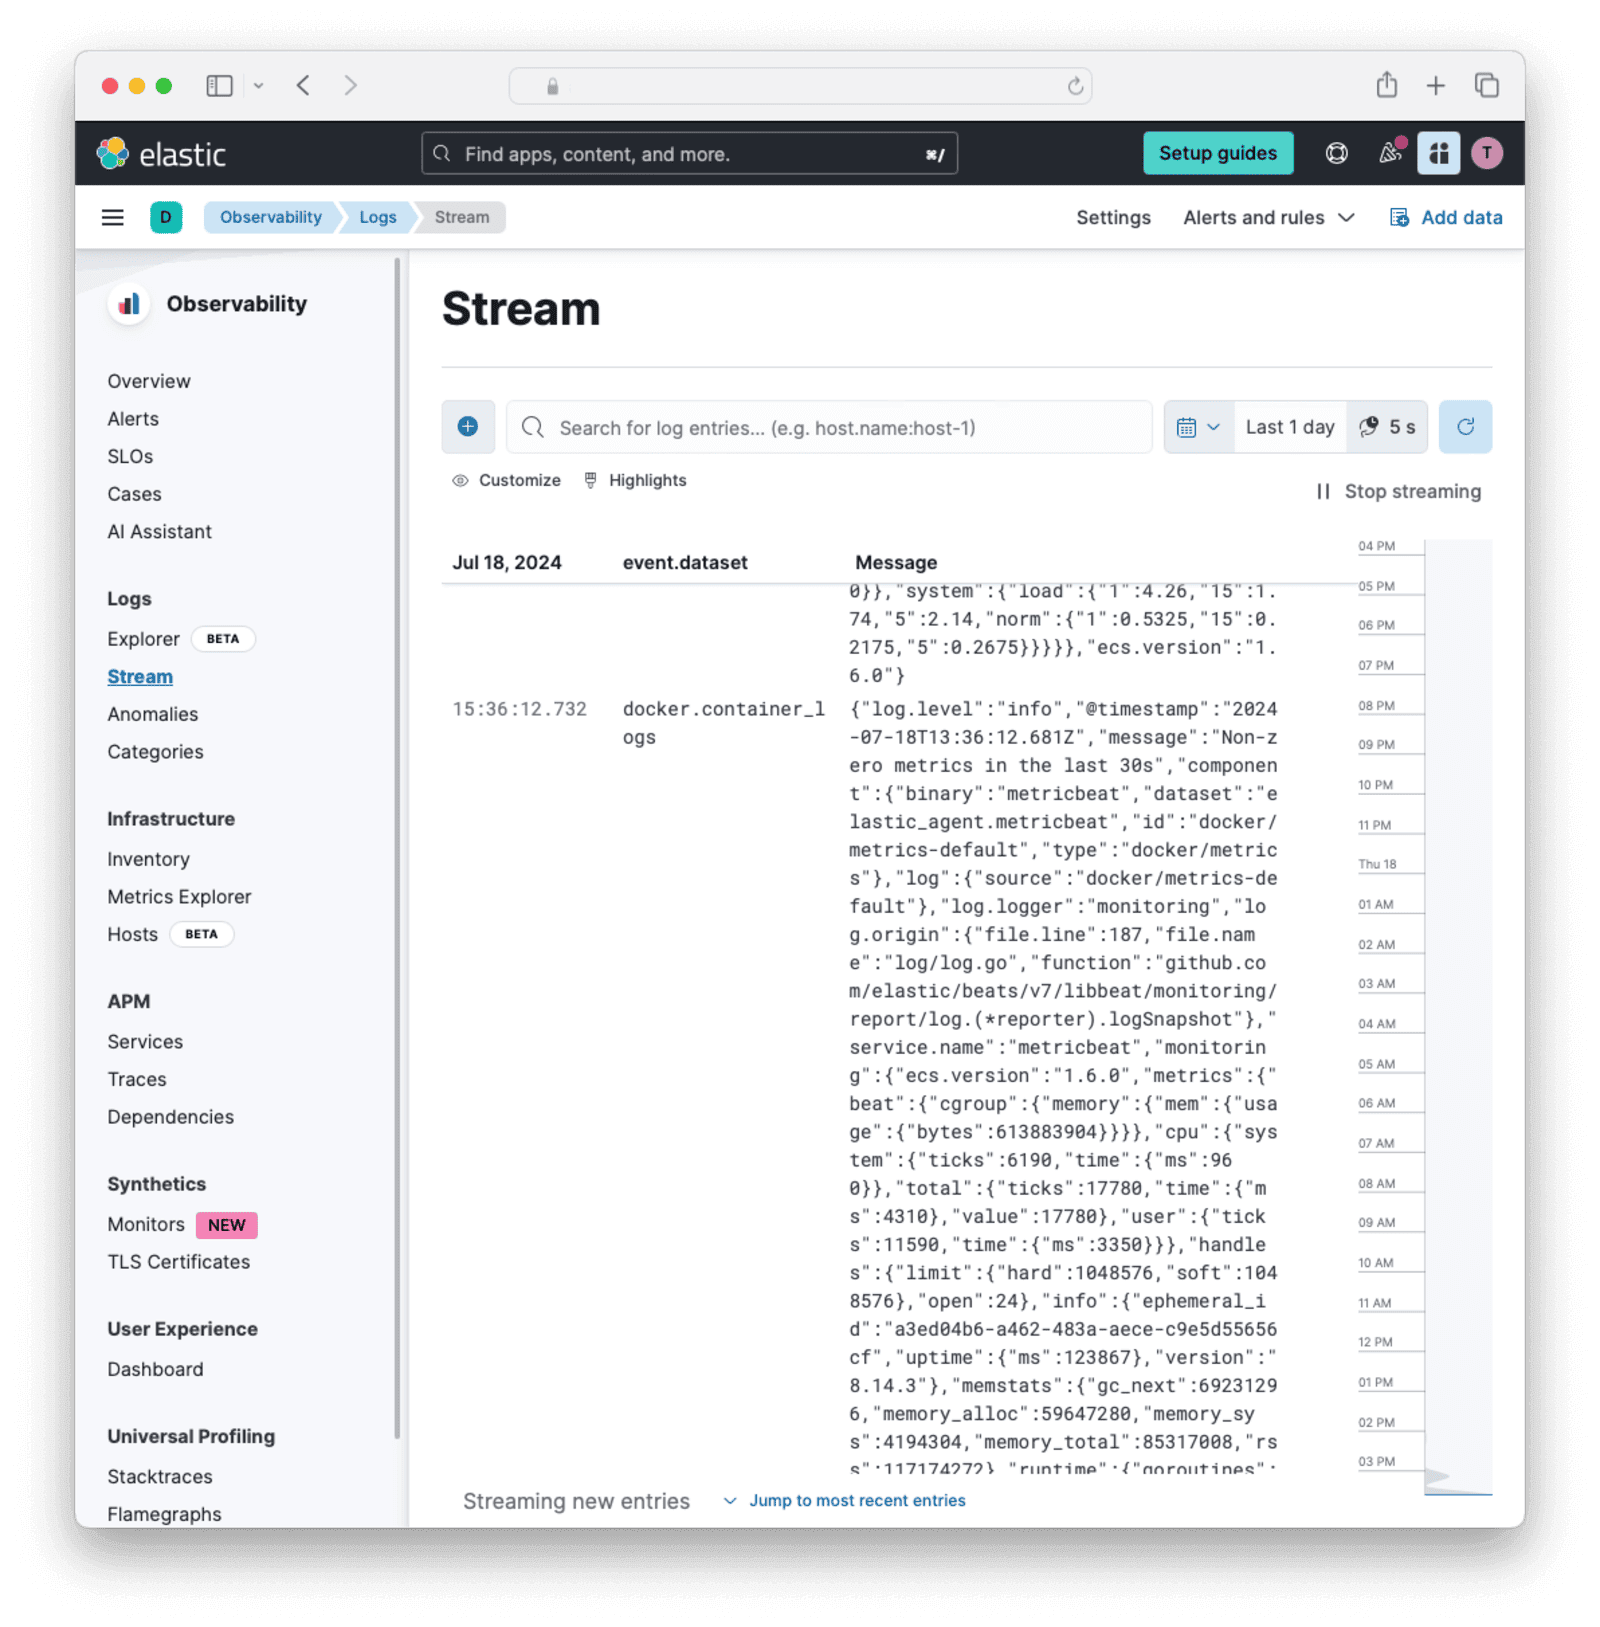
In the Elastic Cloud web interface, browse to the sidebar and then Observability -> Logs -> Stream .
-
Run the other Docker containers with
docker compose up db fa -
You should be able to see the FusionAuth log output appearing in the Elastic web interface.
-
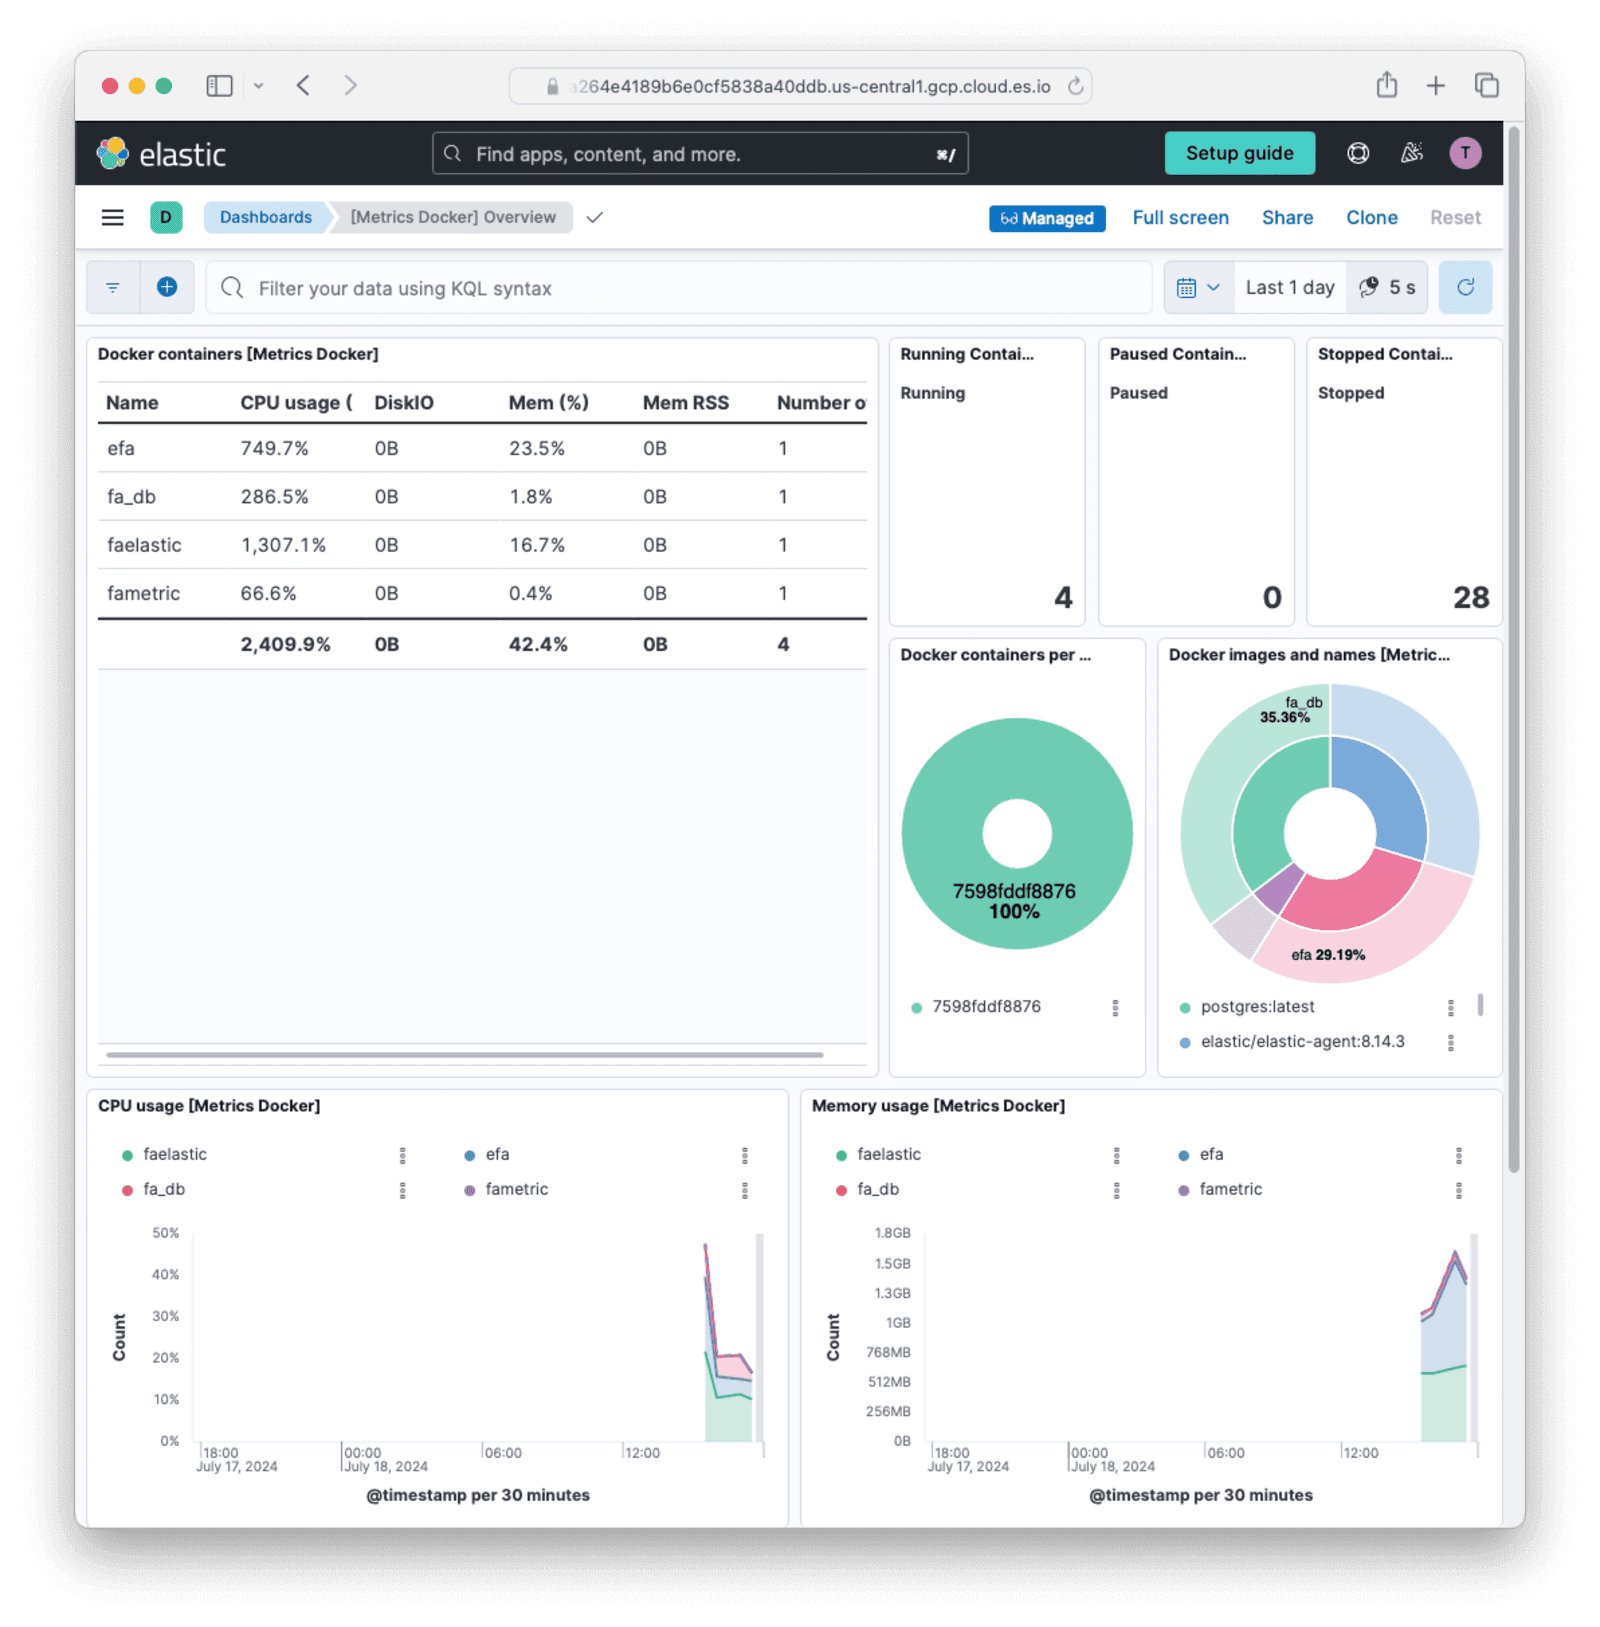
Browse to the sidebar and then Analytics > Dashboards > [Metrics Docker]Overview . You should see details about all your Docker containers.
Monitor The FusionAuth Application Directly With Elastic#
You've learned how to monitor the FusionAuth container in two different ways. Since a Docker container will exit if the process it runs exits, this monitoring will tell you if FusionAuth dies, which might be enough for you to know. But if you want to monitor details about the FusionAuth app itself, there are various approaches:
- Use an Elastic APM (application performance monitoring) app for Java inside the FusionAuth container to monitor the Java Virtual Machine. Since monitoring Java won't give you any useful information that monitoring the container doesn't already, you can ignore this idea. There is a guide to running FusionAuth with a Java monitoring app by altering the Dockerfile in the FusionAuth Splunk guide if you would like to try.
- Use an OpenTelemetry Java monitoring agent to send information about FusionAuth to Elastic. This is similar to the previous point - OpenTelemetry won't provide any useful information that container monitoring doesn't already. Using OpenTelemetry is also shown in the FusionAuth Splunk guide. Elastic has a guide to Java here that you can use with the Splunk guide.
- Use a specialized Elastic service like Heartbeat to connect to the FusionAuth HTTP server and see if it returns correctly. You can install Heartbeat in a container like we did for Elastic Agent in the previous section, and point it to the FusionAuth URL. A guide on Heartbeat is here.
- Send custom metrics from FusionAuth to Elastic. This is the most complex option, as you need to write a custom service to request FusionAuth metrics, extract them from the given zip file, and upload them to Elastic using the Elastic API. However, this is the only way to get precise information about FusionAuth if you want that level of detail. This option will be discussed in the next section.
Send Custom FusionAuth Metrics To The Elasticsearch API#
There are three possible ways to send custom data to Elastic:
- Write your own service to run continuously, get data, and send it by calling the Elasticsearch API.
- Build a custom private module in Go for MetricBeat, compile the module with MetricBeat, and deploy the output to a container. MetricBeat is similar to Elastic Agent. It is an Elastic service that runs continuously, calling whatever integration it's configured with. To write a custom module (integration), follow the Elastic developer documentation.
- Deploy MetricBeat in a container with the stock HTTP module. The HTTP module can call any custom API. Write a web service in another container as an interface between MetricBeat and FusionAuth. This service will get whatever metrics you want from FusionAuth and return them in the HTTP response.
Each option has disadvantages. While calling the API directly has the least code, it is low-level work that moves away from using the Elastic components as intended and requires you to configure values to group your custom data with other data from Elastic Agent in the dashboard. Using MetricBeat is Elastic's recommended solution, but it means writing and compiling Go code for every service change or running an additional Docker container with its own web service.
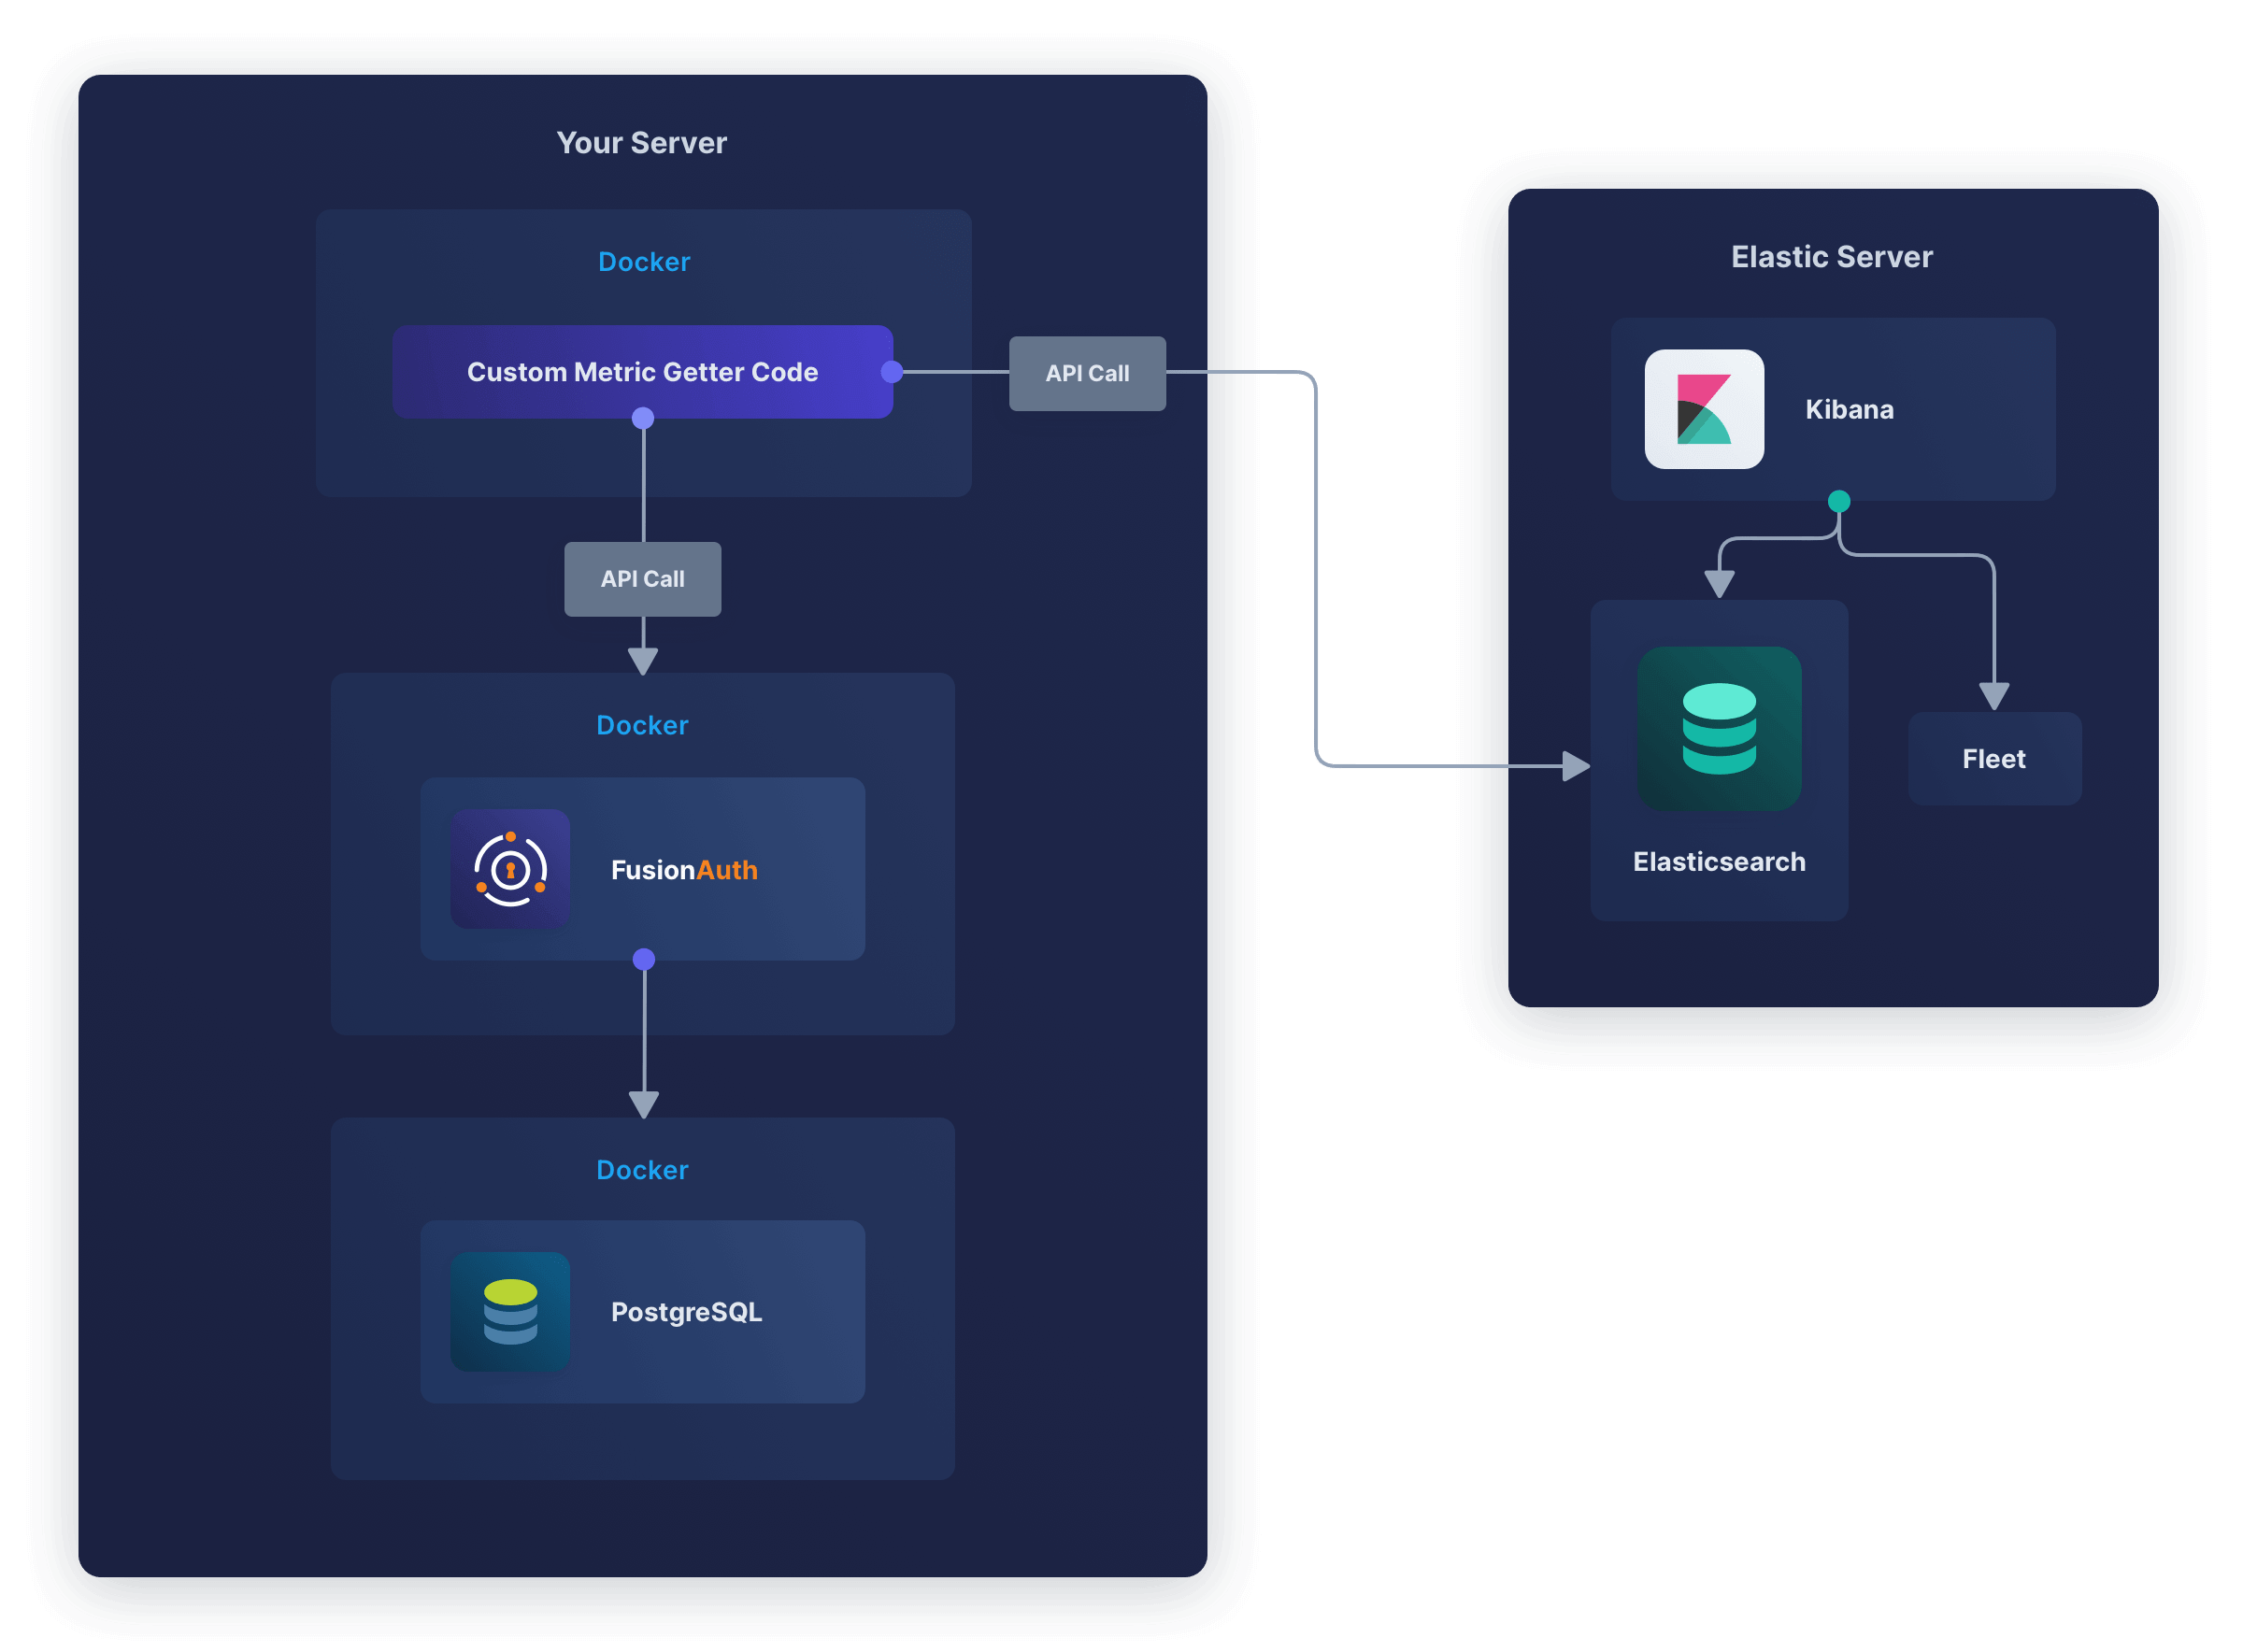
This guide will show you how to send FusionAuth metrics to the Elasticsearch API by creating a custom Docker service that calls the FusionAuth API and sends metrics directly to the Elastic API.
The design looks like the diagram below.
Which Metrics To Monitor#
FusionAuth has too many metrics to discuss in this article. You will need to decide which are important for you to monitor by reading the documentation.
In addition to the metrics available through the various FusionAuth APIs, you can create your own metrics using any event that can trigger a webhook. This webhook can call another Docker container you create that listens for incoming events and forwards them to Elastic.
A useful metric to start with is login counts. If this number drops from the average, it's a good sign something might be wrong with your system. In this guide, you'll learn how to create a program that uses the FusionAuth API to get the login count, then upload it to Elastic.
You can add any other metrics you want to this service.
Create An Elastic API Key#
Earlier you used an enrollment token tied to a specific Agent Policy to configure Elastic Agent. Now, to call the Elasticsearch API directly, you need an API key.
- In the Elastic Cloud web interface, open the sidebar and browse to Search -> Elasticsearch .
- Click Endpoints & API keys.
- Note your endpoint and cloud Id values.
- Click New API key.
- Give it a name and enable "Security Privileges" and "Metadata".
- Click Create API Key.
- Securely save the key to use later. Never commit the key to Git, which can expose it on the internet.
Create An Elasticsearch Index#
To prepare Elasticsearch for data upload, open a terminal and run the three commands below, using your API key and URL in the first two commands. The API key is the value of the encoded field from the JSON in Elastic, not the api_key field.
export elasticKey="WGdLQ=="
export elasticUrl="https://c301.us-central1.gcp.cloud.es.io:443"
curl -X PUT "${elasticUrl}/falogins" -H "Authorization: ApiKey ${elasticKey}" -H "Content-Type: application/json" -d'
{
  "mappings": {
    "properties": {
      "timestamp": { "type": "date" },
      "value": { "type": "text" }
    }
  }
}'

# Result:
# {"acknowledged":true,"shards_acknowledged":true,"index":"falogins"}
These commands create an index (think of an index as a database table) to which you can upload FusionAuth metrics. If you receive an authentication or 404 error, please check your URL and API key settings.
Check that the index exists by running the command below.
curl "${elasticUrl}/falogins" -H "Authorization: ApiKey "${elasticKey}"" -H "Content-Type: application/json"

# Result:
# {"falogins":{"aliases":{},"mappings":{"properties":{"timestamp":{"type":"date"},"value":{"type":"integer"}}},"settings":{"index":{"routing":{"allocation":{"include":{"_tier_preference":"data_content"}}},"number_of_shards":"1","provided_name":"falogins","creation_date":"1721213253232","number_of_replicas":"1","uuid":"JXwp3mzBTJqkQH6sNkEvPg","version":{"created":"8505000"}}}}}
Let's review the index in Elastic Cloud.
-
In the web interface, open the sidebar, and browse to Management -> Stack Management -> Index Management .
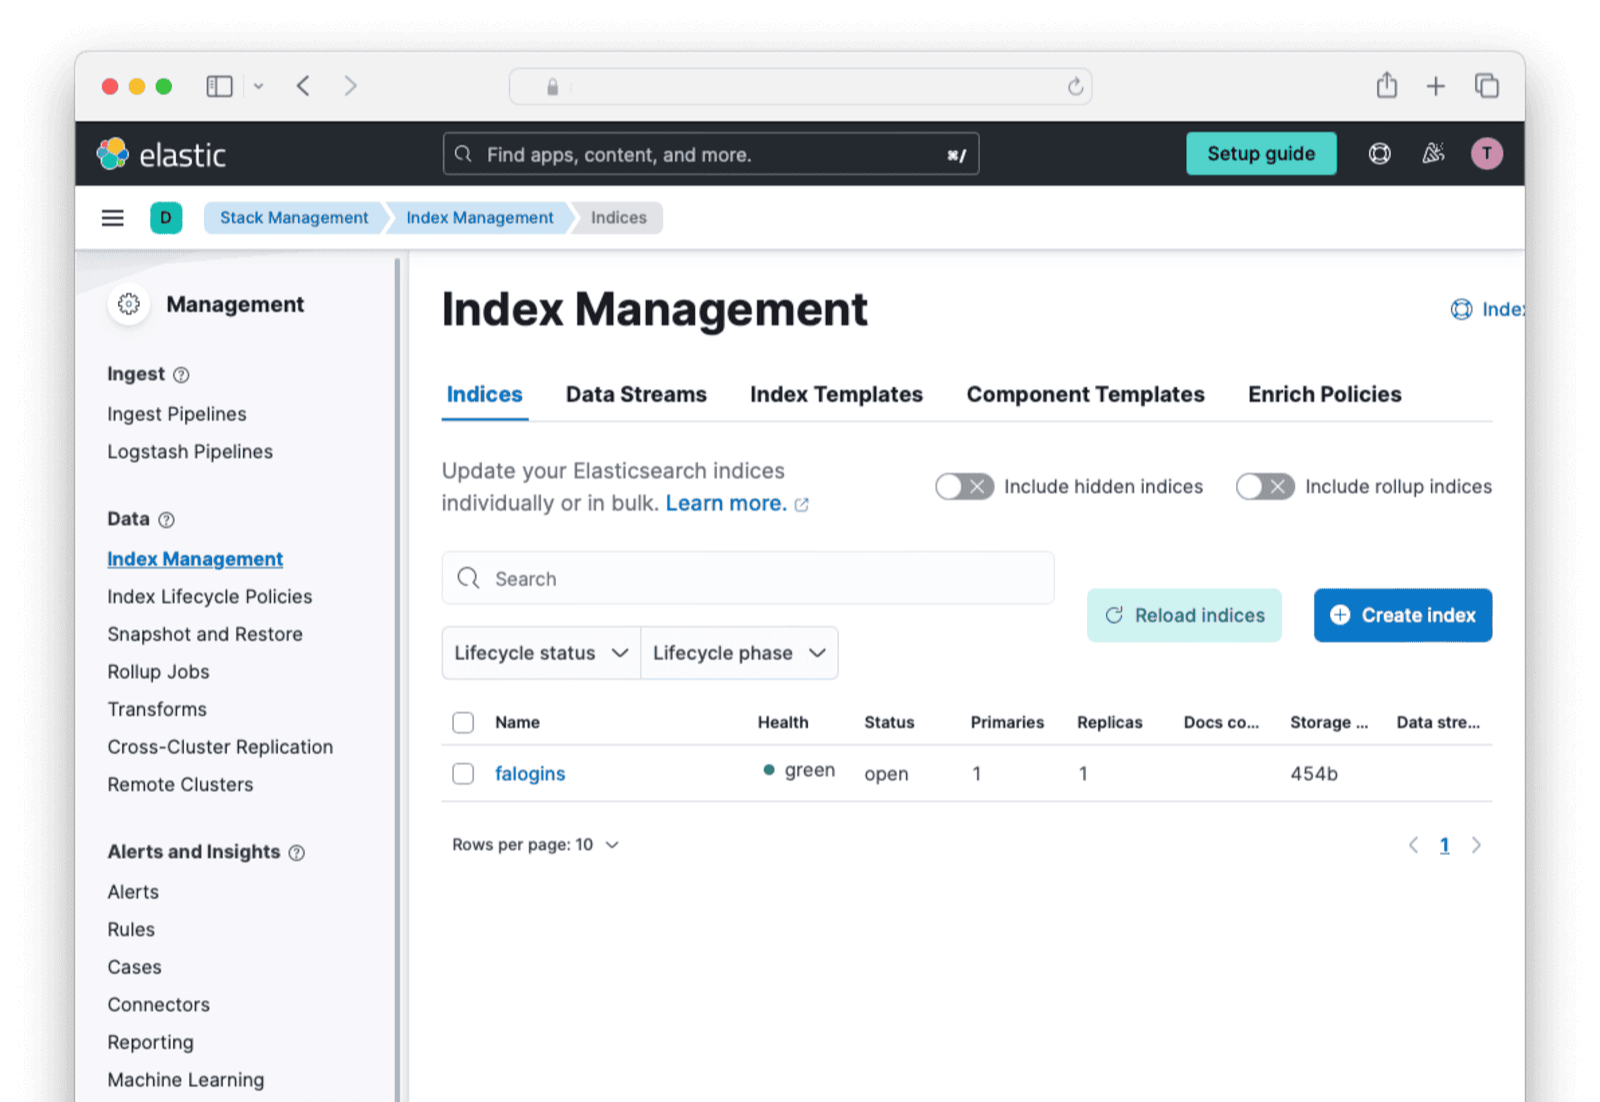
-
You should see
faloginsin the list. Click it. -
Click the Mappings tab.
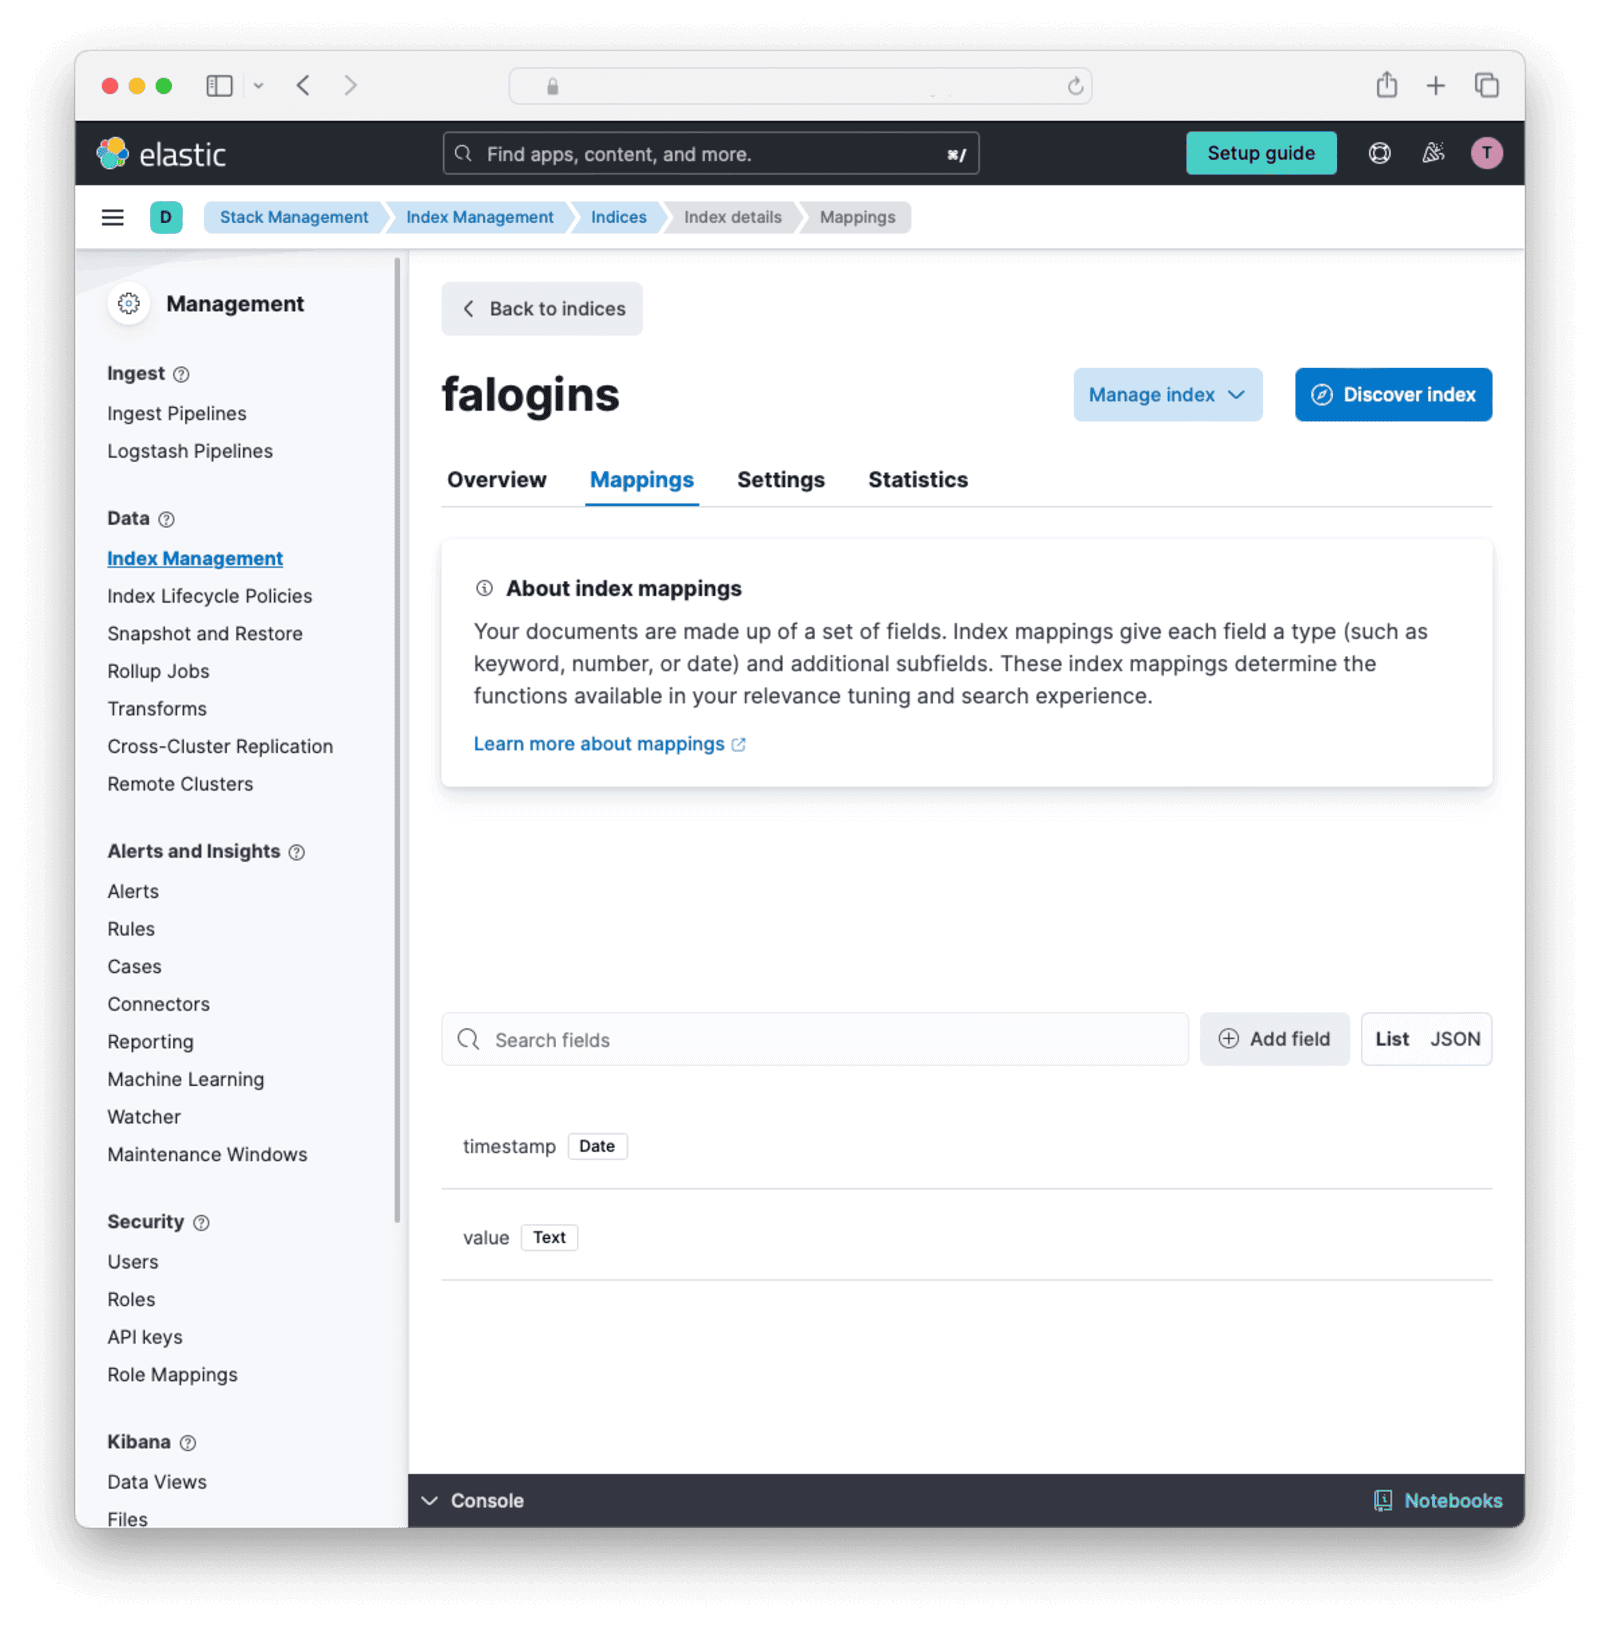
You can now see the type of data that the index will accept. You can create indexes manually instead of using the API if you like. Creating mappings manually will show you all the types of fields that Elasticsearch supports.
Write A Custom Service To Send Data To The API#
Let's get the login records every ten seconds and send them to Elastic. All the FusionAuth APIs that give you event data are documented here. The login records API is documented here. Note that, while the documentation says the date format is the standard Java type, some constants like ISO_LOCAL_DATE_TIME are not supported. You need to enter the format string you want manually.
Unfortunately, all the APIs export events as zip files — you will not get JSON or YAML data in memory. You will need to create a script that gets the zip file, extracts it, reads it, formats the entries for Elastic, and uploads them.
Browse to FusionAuth, which is at http://localhost:9011 if you are running through the default Docker setup. Log in and look for your application Id in System -> Login Records .
Next, create an API key by navigating to Settings -> API Keys and clicking the button. Enter a Description for the API key and click on the button to save the API key. On the API Keys list page, click the red lock next to the newly generated key to reveal the key value. Copy and save the key.
Create a file called app.sh. Insert the content below, replacing your FusionAuth API key, FusionAuth application Id, and your Elastic API key and Elastic URL.
#!/bin/sh

# exit on error
set -e

# get login records from fusionauth
faUrl="http://fa:9011/api/system/login-record/export" # use "http://localhost:9011... for testing this script outside of Docker
faKey="33052c8a-c283-4e96-9d2a-eb1215c69f8f-not-for-prod"
faAppId="3c219e58-ed0e-4b18-ad48-f4f92793ae32"
elasticKey="WGdNxOUkwQQ=="
elasticUrl="https://c36cbc1.us-central1.gcp.cloud.es.io:443"
dateFormat=$(echo -n "yyyy-MM-dd'T'HH:mm:ss.SSS" | jq -sRr @uri)
end=$(date +%s)000
start=$(($end - 3600000))
params="applicationId=${faAppId}&dateTimeSecondsFormat=${dateFormat}&start=${start}&end=${end}"
url="${faUrl}?${params}"
echo "curl -H \"Authorization: ${faKey}\" -o record.zip \"$url\""
curl -H "Authorization: ${faKey}" -o record.zip "$url"
unzip -o record.zip
cat login_records.csv

# for each record, get the user and  unix time in ms
tail -n +2 login_records.csv | while IFS=',' read -r userId time rest; do
  userId=$(echo "$userId" | tr -d ' "' )
  time=$(echo "$time" | tr -d ' "')                      # 2024-06-21T05:14:56.123
  time=$(echo "$time" | tr 'T' ' ')                      # 2024-06-21 05:14:56.123
  sec="$(date -d "$(echo $time | cut -d '.' -f 1)" +%s)" # 1718946896
  ms="$(echo $time | cut -d '.' -f 2)"                   # 123

  # make the POST data
  data=$(cat <<EOF
{
  "timestamp": ${sec}${ms},
  "value": "${userId}"
}
EOF
)

  # send data to Elastic API
  curl -X POST "${elasticUrl}/falogins/_doc" -H "Authorization: ApiKey ${elasticKey}" -H "Content-Type: application/json" -d "$data"

done
This script gets all login records in the last hour to be sure the zip file has some data. In reality, replace 3600000 with 10000 so that when the script runs every ten seconds, it gets only the latest records. Note that FusionAuth uses milliseconds instead of the epoch standard of seconds, so the script has to append 000 to the normal Unix time.
The file returned from FusionAuth unzips to login_records.csv, which looks like the data below.
| "User Id " | "Time " | "Application Id " | "IP Address " | "City " | "Country " | "Zipcode " | "Region " | "Latitude " | "Longitude " |
|---|---|---|---|---|---|---|---|---|---|
| ba81f3e2-3b0f-4d64-930f-38298de9dc0d | 2024-06-21T05:14:56.123 | 3c219e58-ed0e-4b18-ad48-f4f92793ae32 | 172.20.0.1 | ||||||
| ba81f3e2-3b0f-4d64-930f-38298de9dc0d | 2024-06-21T05:07:06.406 | 3c219e58-ed0e-4b18-ad48-f4f92793ae32 | 172.20.0.1 |
The records in this file look different from those in the FusionAuth console. Only Ids are given here, not email addresses or application names.
The second half of the script reads in the CSV file, discards the header, and sends the user Id and the time of each login to Elastic.
Create a file called metricDockerfile. Insert the content below.
FROM --platform=linux/amd64 alpine:3.19
RUN apk add --no-cache curl jq nano
COPY app.sh /app.sh
RUN chmod +x app.sh
CMD watch -t -n 10 /app.sh
Build the container with the command below.
docker build -f metricDockerfile --platform linux/amd64 -t metricimage .Edit your docker-compose.yml file and add the new service as follows.
  fametric:
    image: metricimage
    container_name: fametric
    networks:
      - db_net
Now run all the containers with docker compose up.
The output should be as below. Since you logged in within the last hour, there will be one row in the exported file and one value will be sent to Elastic. If you don't see any rows displayed on the screen, log in to FusionAuth again.
curl -H "Authorization: 33052c8a-c283-4e96-9d2a-eb1215c69f8f-not-for-prod" -o record.zip "http://fa:9011/api/system/login-record/export?applicationId=3c219e58-ed0e-4b18-ad48-f4f92793ae32&dateTimeSecondsFormat=yyyy-MM-dd%27T%27HH%3Amm%3Ass.SSS&start=1721215014000&end=1721218614000"
fametric  |   % Total    % Received % Xferd  Average Speed   Time    Time     Time  Current
fametric  |                                  Dload  Upload   Total   Spent    Left  Speed
100   319    0   319    0     0  42962      0 --:--:-- --:--:-- --:--:-- 45571
fametric  | Archive:  record.zip
fametric  |   inflating: login_records.csv
fametric  | "User Id ","Time ","Application Id ","IP Address ","City ","Country ","Zipcode ","Region ","Latitude ","Longitude "
fametric  | 00000000-0000-0000-0000-000000000001,2024-07-17T05:26:05.740,3c219e58-ed0e-4b18-ad48-f4f92793ae32,172.21.0.1,,,,,,
fametric  | 00000000-0000-0000-0000-000000000001,2024-07-17T05:25:59.800,3c219e58-ed0e-4b18-ad48-f4f92793ae32,172.21.0.1,,,,,,
If the metric has not uploaded correctly, you can debug the container by running docker exec -it fametric sh in a new terminal. Once in the container, you can alter the script with nano /app.sh. Add -v to the curl command to see verbose output. Run the script with /app.sh.
If you have trouble calling the FusionAuth API, review the troubleshooting tips.
If you alter app.sh in your host machine and want to rerun the containers, use the command below.
clear; docker build -f metricDockerfile --platform linux/amd64 -t metricimage .; docker compose upYou can follow the process described here to add other FusionAuth API calls to app.sh to get other metrics to send to Elastic.
View The Metrics In Kibana#
The final step to use your metrics is to create a dashboard to view them in Kibana. You are going to show recent logins on a timeline to indicate the health of FusionAuth. Since the UserId field is free text and thus not aggregatable, you will not be able to visualize it, but it will be available for search if you need to run queries against users in Elasticsearch.
- In the Elastic Cloud web interface, open the sidebar and browse to Search -> Elasticsearch -> Indices -> falogins -> Documents . You should see data in the table. If not, please run
app.shmanually and debug where it is failing, paying attention to all API keys and URLs.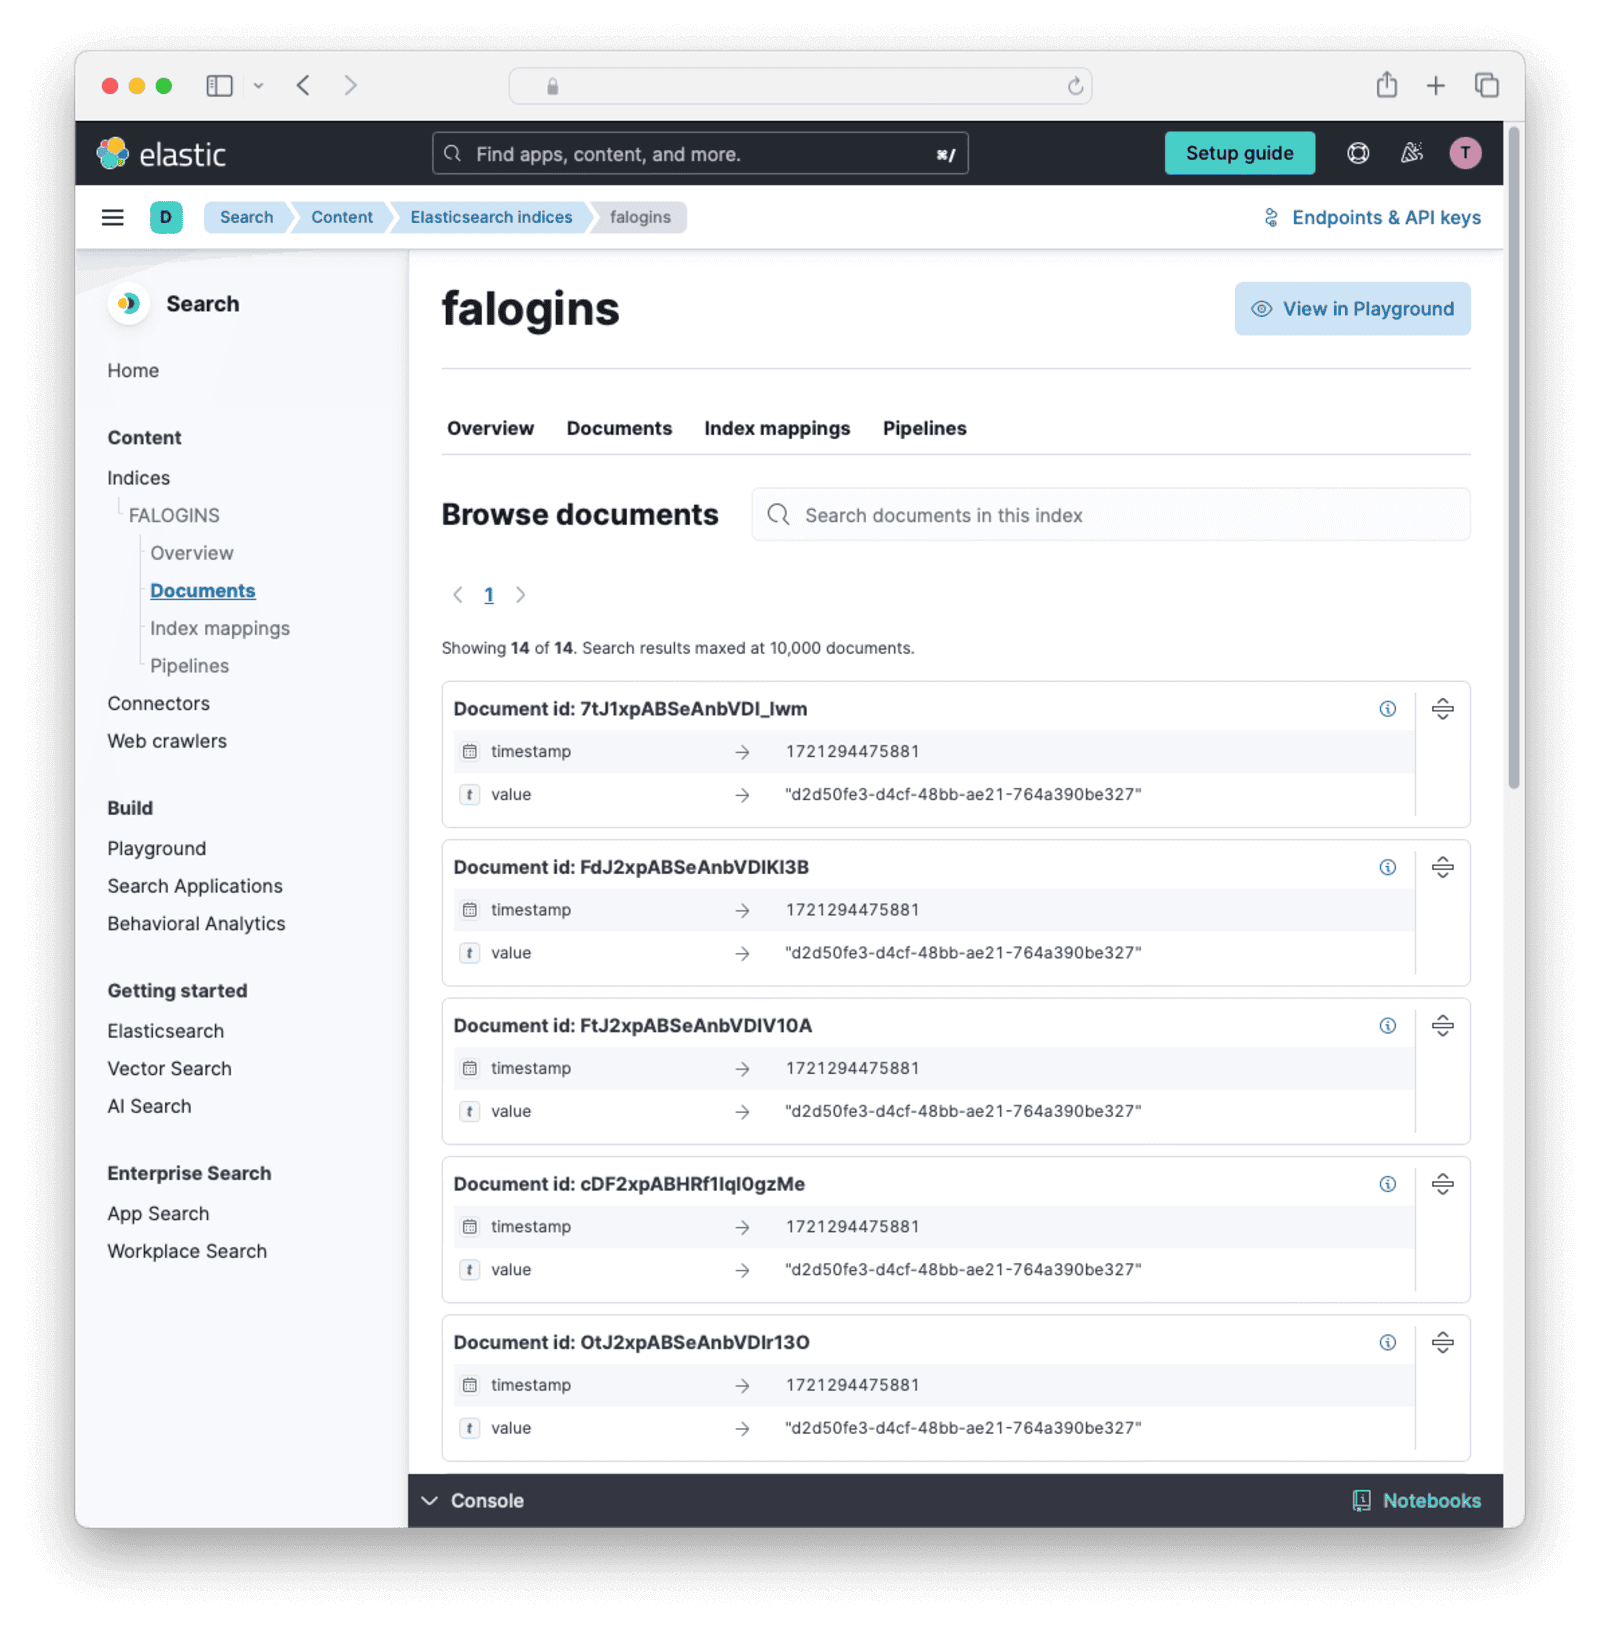
- In the sidebar, browse to Analytics -> Dashboards -> Create dashboard -> Create visualization .
- In the index combo box in the top left, change from
logs-*tofalogins. - Click the + button next to "timestamp" to add it to the dashboard.
- Change the time in the top right to "Today".
- Change the visualization type to "Bar vertical".
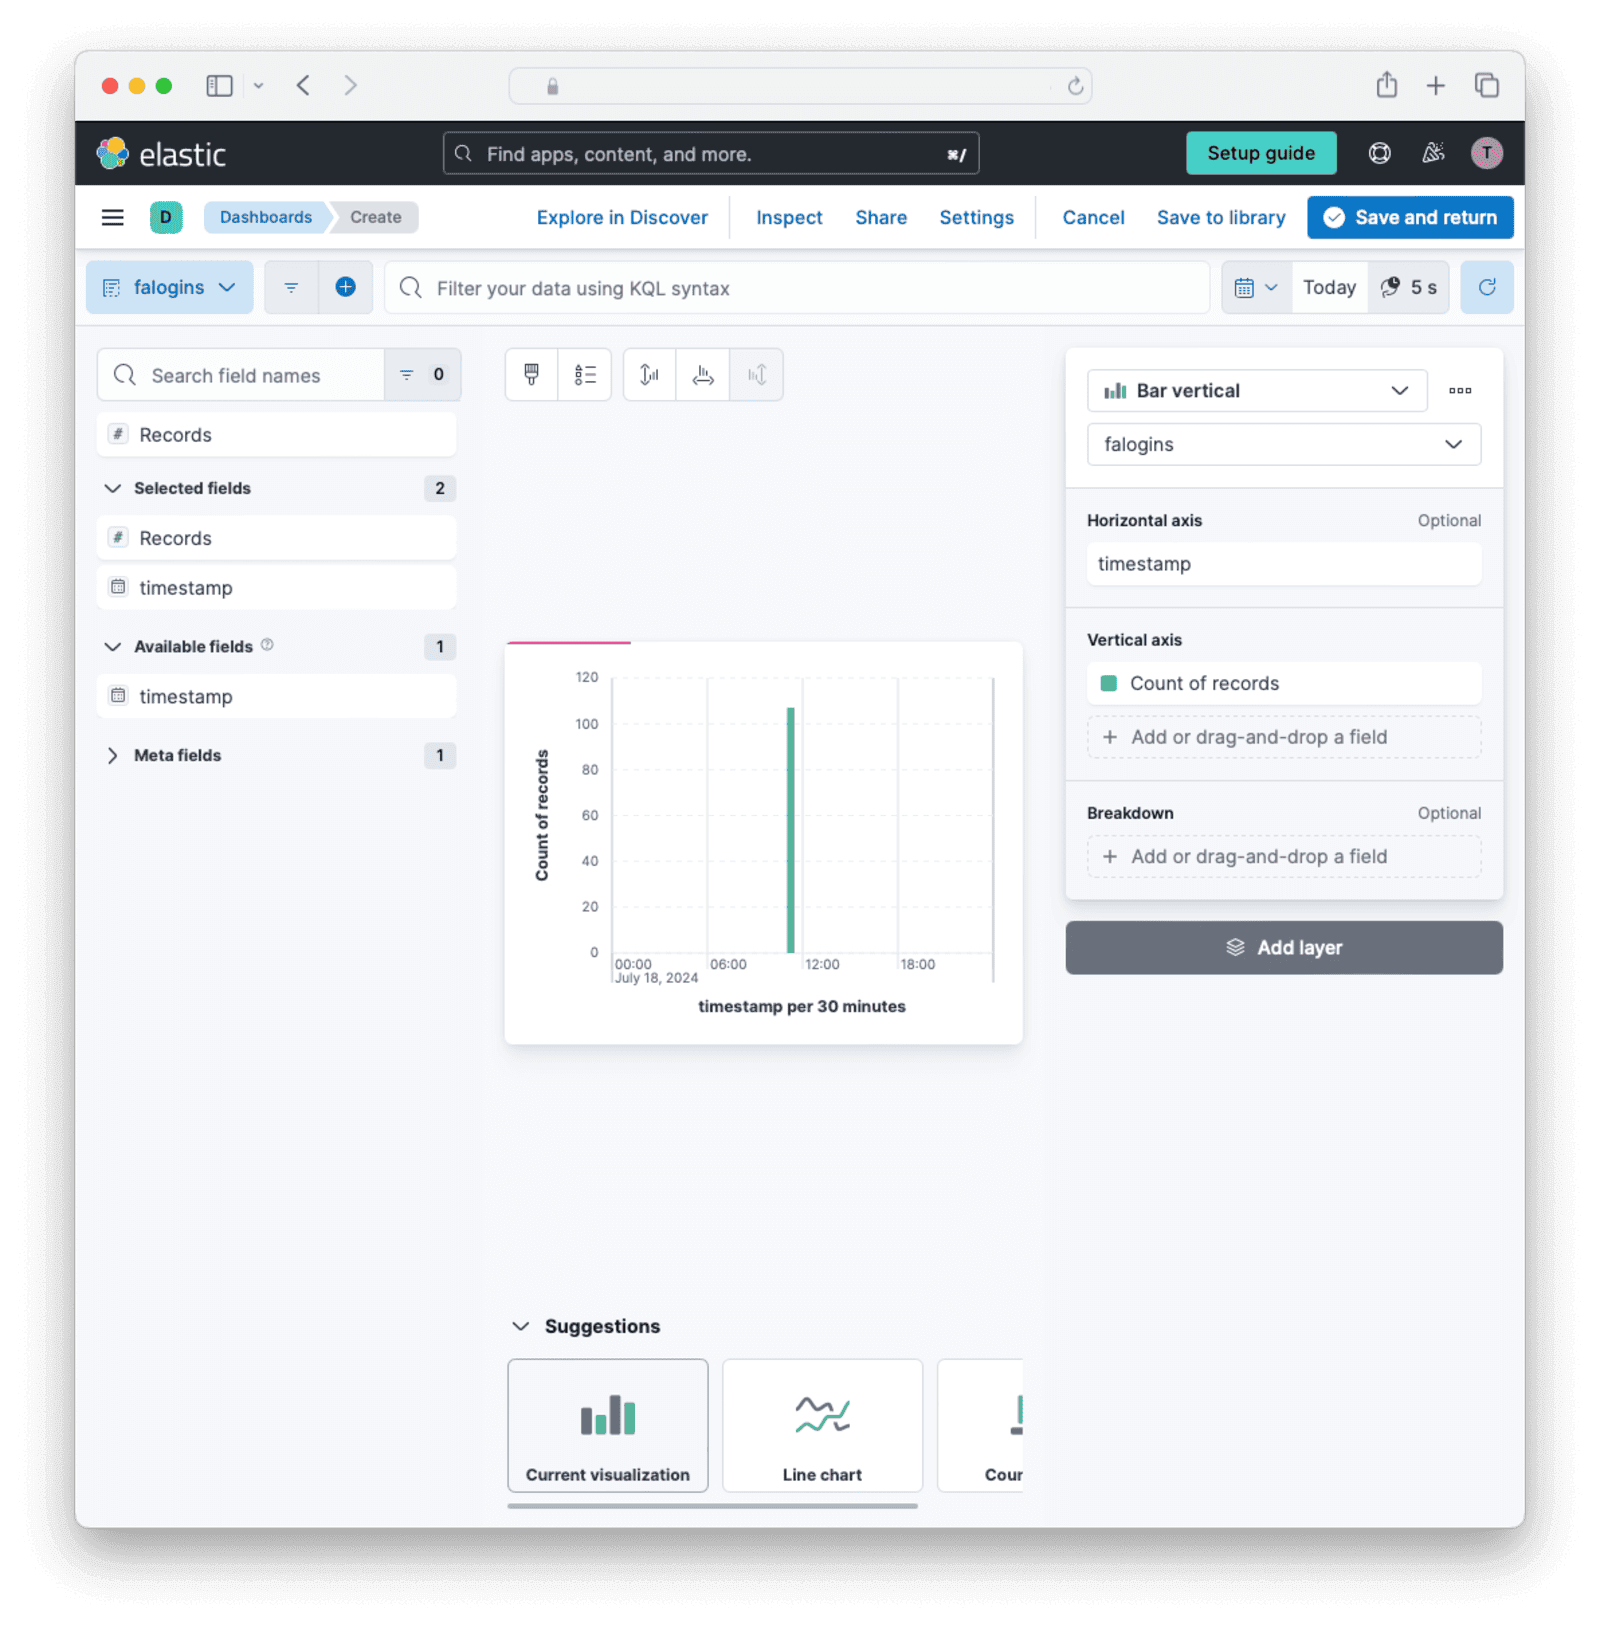
- Click Save and return.
- Click Save.
- Give the dashboard a name like
FusionAuth login rateand save.
You now have a dashboard to monitor the health of FusionAuth. Following the process in this section, you can extract any metrics from the FusionAuth API, create an index for them in Elastic, upload the metrics in a Docker container, and create a dashboard for them in Kibana.
Final System Architecture#
A relatively simple but adequate monitoring architecture with Elastic might look as follows.
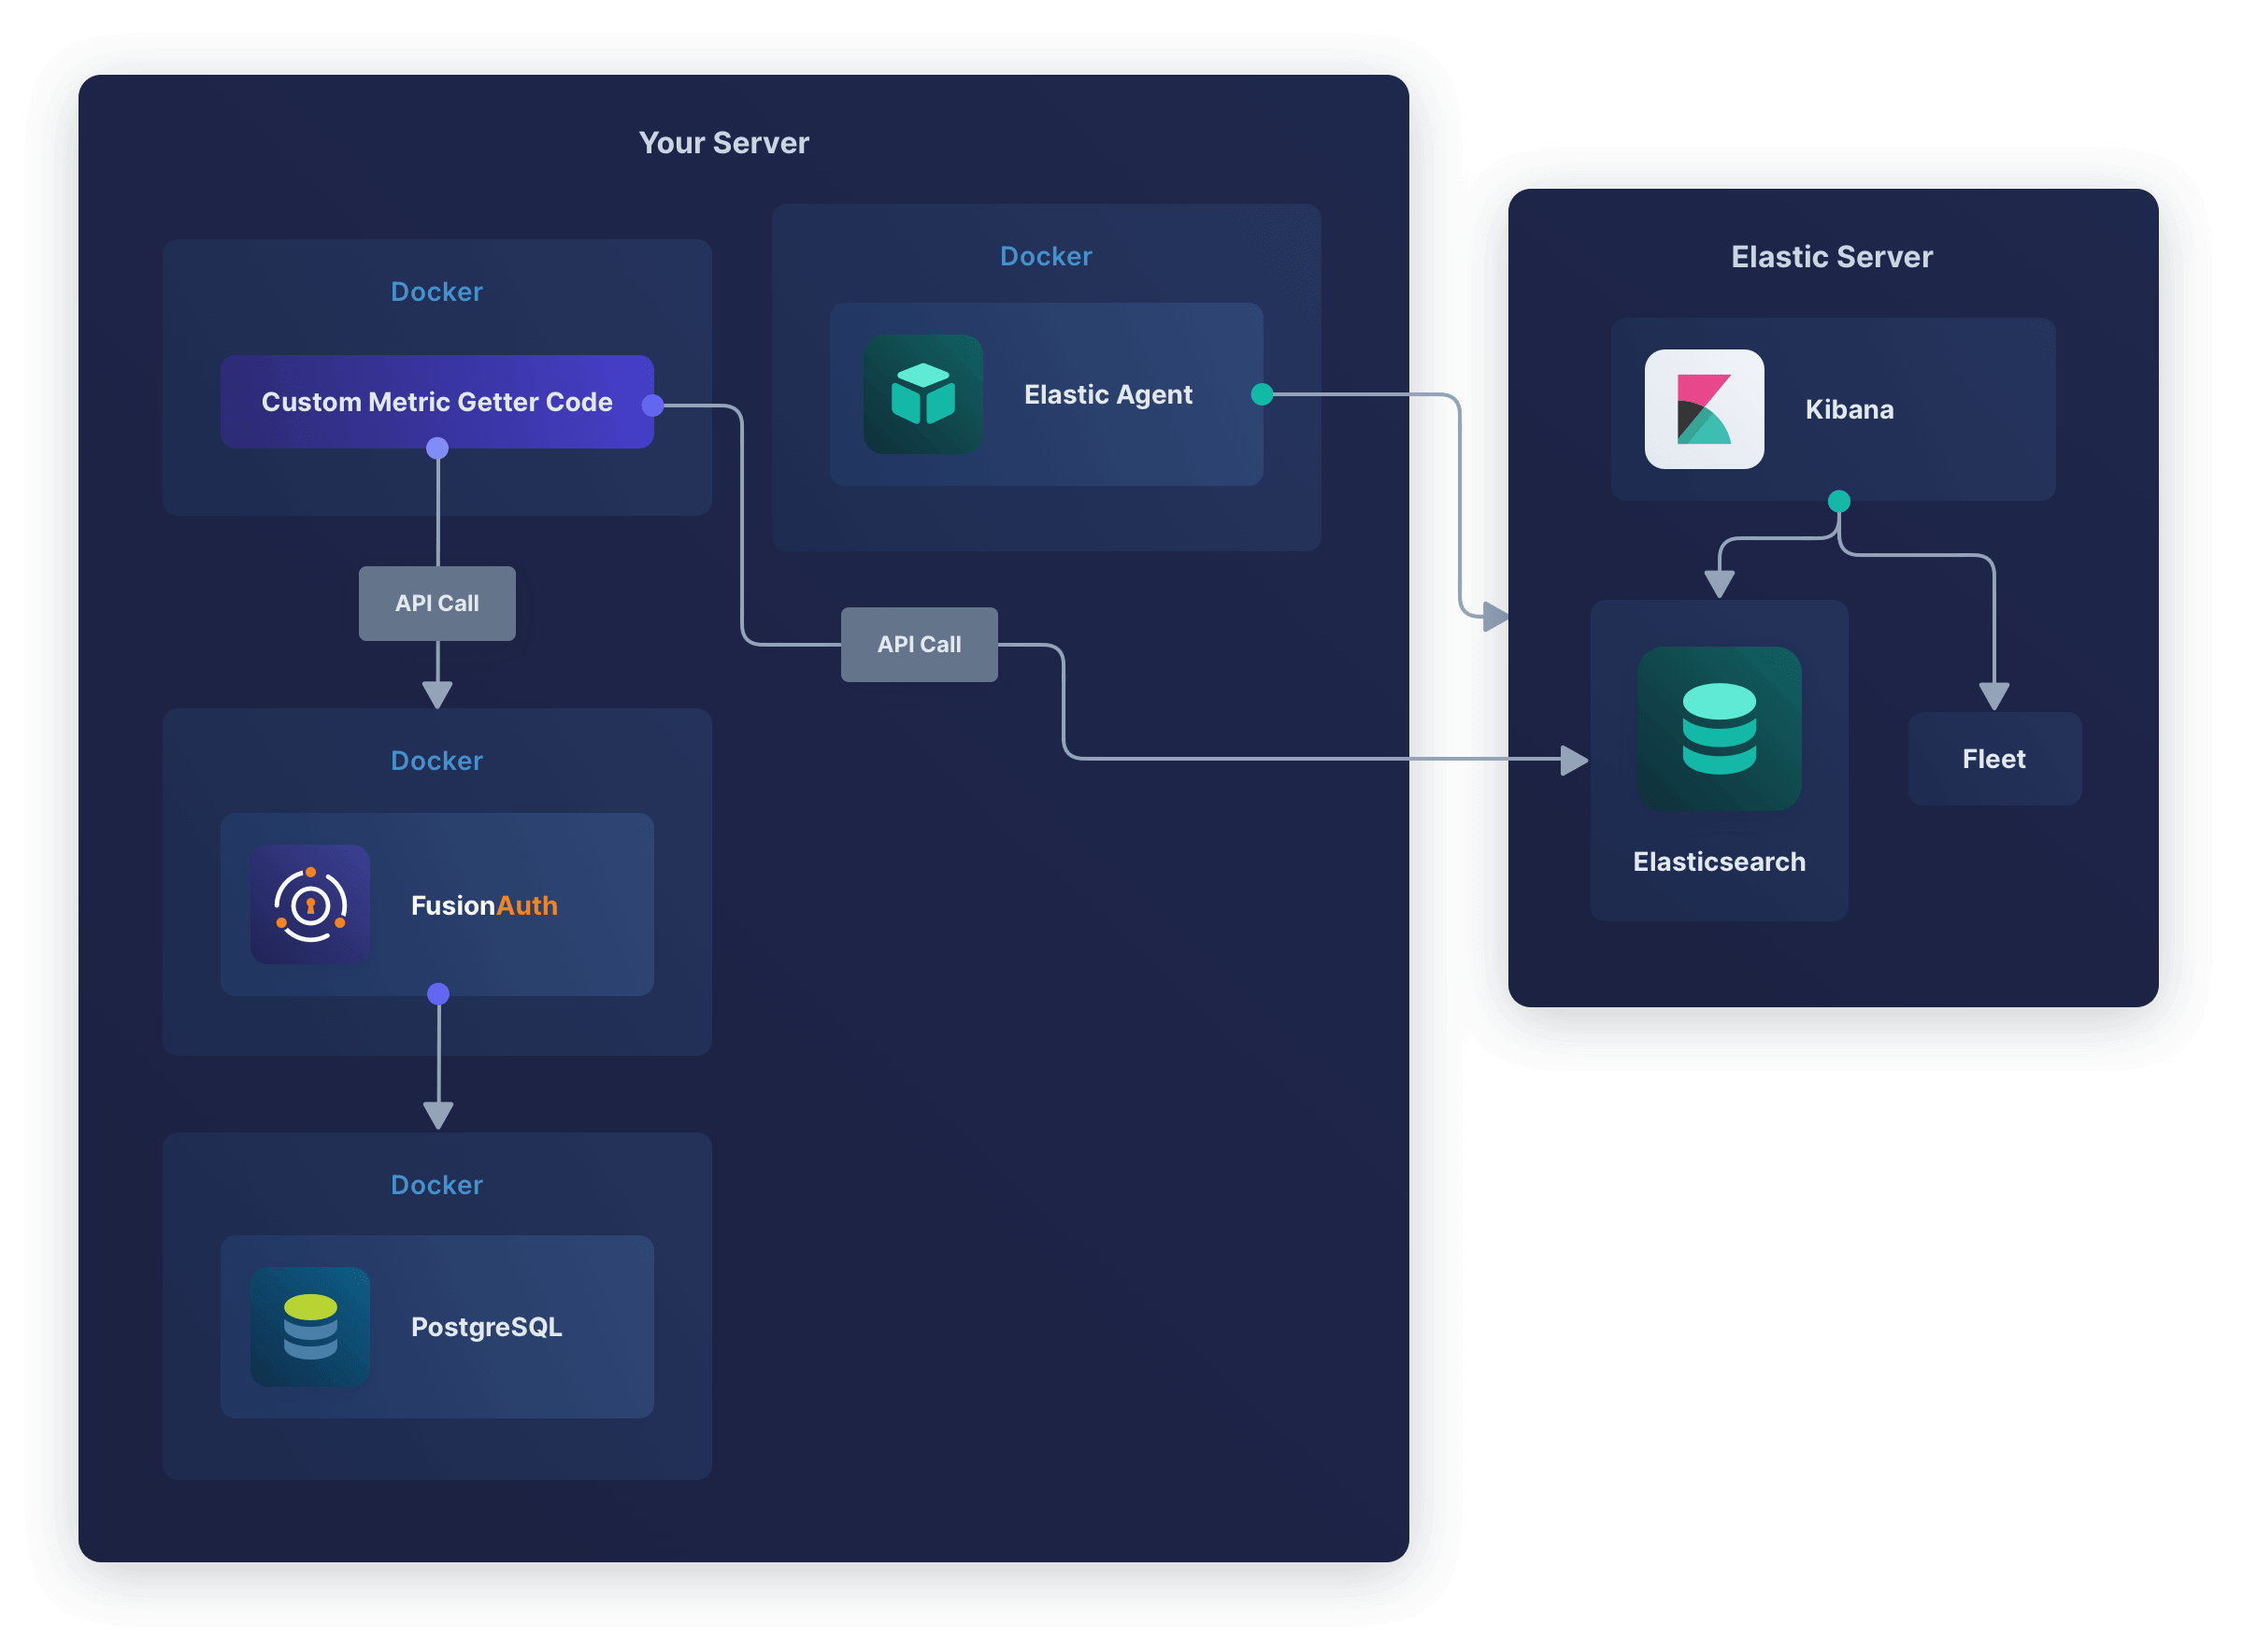
In this design, Elastic Agent monitors all Docker infrastructure and the FusionAuth logs, while the custom metric service provides fine-grained FusionAuth data to Elastic to monitor the app itself.
Next Steps#
Now that you can monitor FusionAuth in Elastic, you should enable Elastic alerts to notify you by email or in Slack if something goes wrong, like a massive decrease in login rates, a Docker container restarting, or a log output containing error.